Join Our Telegram channel to stay up to date on breaking news coverage
The Terra price prediction shows that LUNA is recording another downtrend of 8.76%, in the last 24 hours as the coin declines heavily.
LUNA/USD Market
Key Levels:
Resistance levels: $85, $95, $105
Support levels: $40, $30, $20
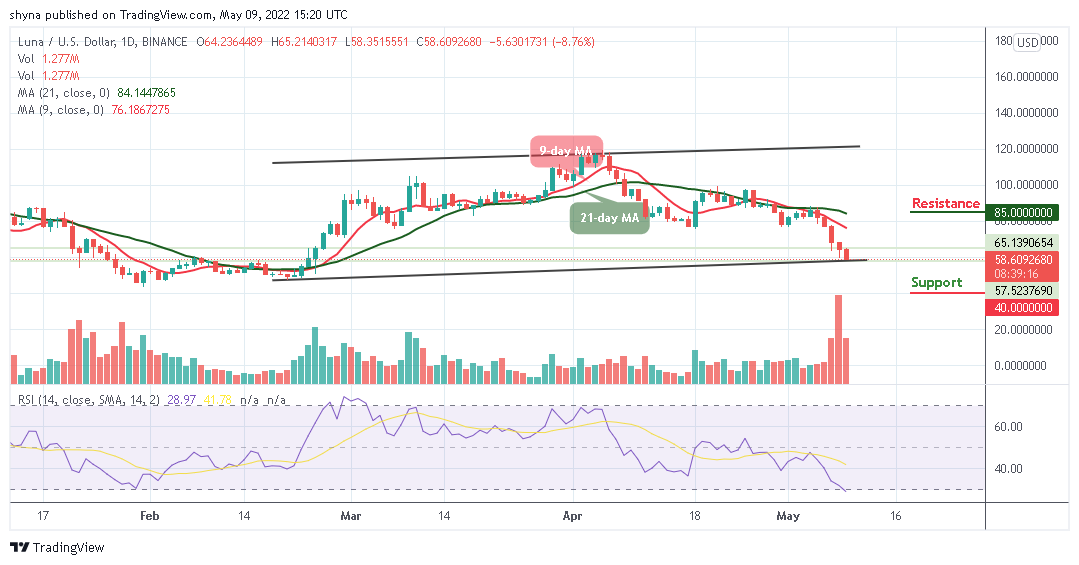
LUNA/USD is currently following the downward movement as the coin drops to a $58.35 low today. The Terra price is gently sliding below the 9-day and 21-day moving averages, aiming to cross below the lower boundary of the channel. The technical indicator Relative Strength Index (14) indicates increasing bearish momentum as the signal line moves to cross into the oversold region, indicating that the market sentiment may continue to be bearish.
Terra Price Prediction: What Could Be the Next Direction?
As the daily chart reveals, the Terra price keeps changing below 9-day and 21-day moving averages where it faces down. However, if the Terra price rises and break above the 9-day and 21-day moving averages, the coin may begin a new upward movement to retest its previous high.
However, the nearest resistance levels might be located around $85, $95, and $105 while the support levels could be found at $40, $30, and $20 respectively giving a low trading volume.
LUNA/BTC Market: Terra Price Heads to the Downside
When compared with Bitcoin, the Terra price has been dropping over the past few days as the coin prepares to cross below the lower boundary of the channel. However, if the Terra price remains on the negative side, the next support level may surface at 1700 SAT after which could then locate the further key support level at 1400 SAT and below if the sell-off later becomes huge.
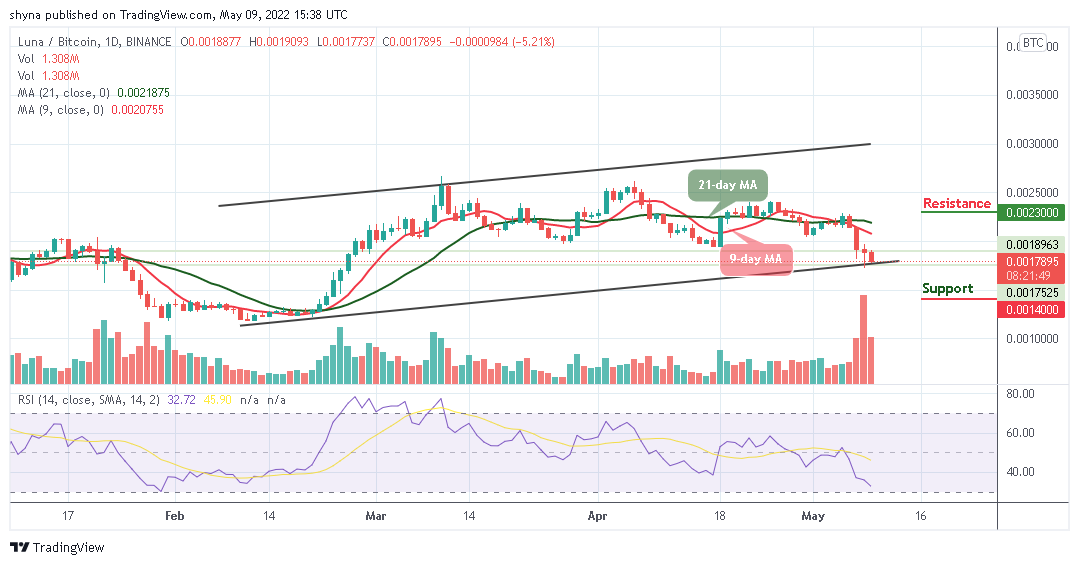
However, on the upside, if the bulls can regroup and push the price above the 9-day and 21-day moving averages, LUNA/BTC could face the 2200 SAT resistance. Any further bullish movement may hit the resistance level at 2300 SAT and above while the technical indicator Relative Strength Index (14) moves toward the oversold region and crossing below this barrier may bring more bearish pressure into the market.
Join Our Telegram channel to stay up to date on breaking news coverage