Join Our Telegram channel to stay up to date on breaking news coverage
The Terra price prediction is being attacked by the bears just as many of the coins in the crypto market are in the red zone.
LUNA/USD Market
Key Levels:
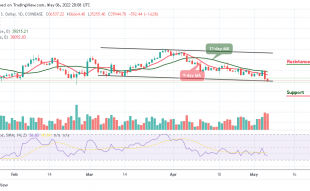
Resistance levels: $100, $110, $120
Support levels: $60, $50, $40

LUNA/USD sudden drop keeps disappointing the traders as the market may soon follow the downtrend. However, the Terra price is sliding below the 9-day and 21-day moving averages. Meanwhile, a couple of days ago, a slight improvement was felt as the coin changed and turned green before reverting to the negative side yesterday.
Terra Price Prediction: Where Would LUNA/USD Head to?
At the moment, the Terra price is changing hands at $78.78 where it faces down. However, if the price rises above the 9-day and 21-day moving averages, it could break the $85 resistance level. However, any further bullish movement may push the coin towards the resistance levels of $100, $110, and $120.
On the other hand, as the Terra price slumps below the moving averages, the bears may bring the coin to cross below the lower boundary of the channel which could hit the supports at $60, $50, and $40. Similarly, the technical indicator Relative Strength Index (14) confirms the downtrend as the signal line moves to cross below the 40-level suggesting more bearish signals in the market.
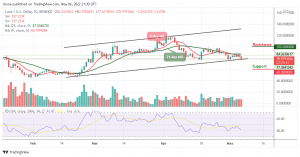
LUNA/BTC Market: Price Is Likely to Follow the Downside
Against Bitcoin, the Terra price is likely to slide below the 9-day and 21-day moving averages with a bearish candle facing the downside. The technical indicator Relative Strength Index (14) is seen moving towards the south which could give more bearish signals to the market. Therefore, further bearish movement may surface as the support level may be located at 1700 SAT and below.
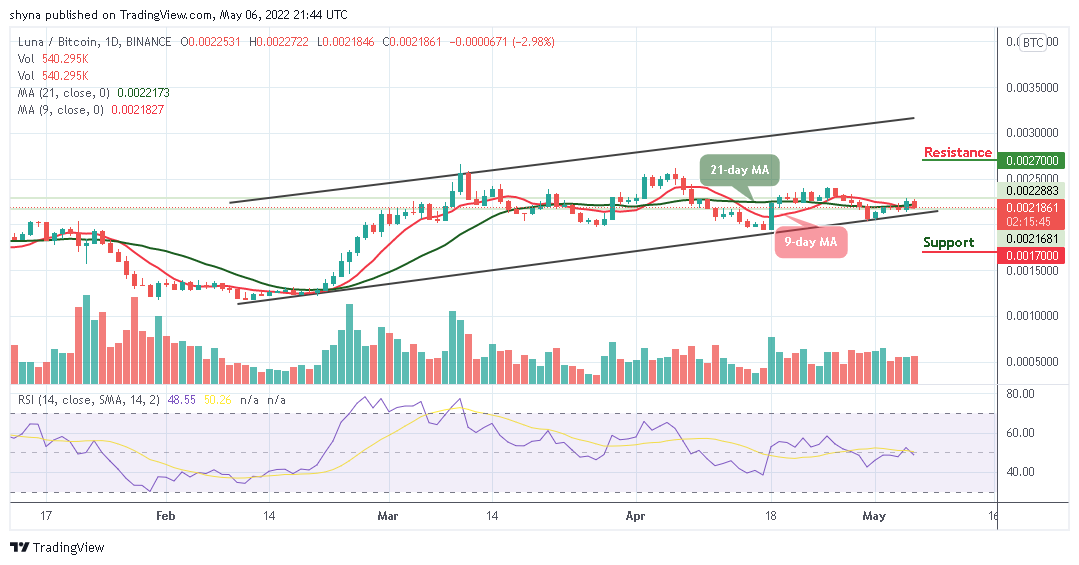
However, if the bulls hijack the price and push it above the moving averages, it could reach the resistance level of 2700 SAT and above. Meanwhile, the bulls may have to gather enough momentum to be able to push the price to the north. Nonetheless, the trading volume is confirming the bearish movement at the time of writing.
Join Our Telegram channel to stay up to date on breaking news coverage