Join Our Telegram channel to stay up to date on breaking news coverage
The Solana price prediction is likely to follow the bullish movement as the coin hovers around the $50 resistance level.
SOL/USD Market
Key Levels:
Resistance levels: $80, $85, $90
Support levels: $15, $10, $5

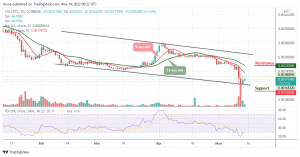
Based on the current prediction, SOL/USD could hit $60 in the next positive step. According to the daily chart, Can we say that the difficult period is over for this crypto as it tries to create a new trend? The Solana price is currently trading at $50.86, although the coin touches the daily high of $53 resistance level after moving close to the 9-day moving average, it could probably retest $48 before it rises again.
Solana Price Prediction: SOL/USD May Follow the Upward Movement
At the time of writing, the Solana price is beginning to follow the upward movement. A break above the $60 level could encourage more buyers to increase their entries, which could push the price to the resistance levels of $80, $85, and $90. On the downside, once the price breaks below the lower boundary of the channel, the sell-off could gain traction with the next focus below the $40, followed by the psychological $35 support.
Moreover, if the above mentioned-supports are broken, the downside pressure may increase while the next supports may be created at around $15, $10, and $5. The technical indicator Relative Strength Index (14) is likely to move away from the oversold region, indicating bullish signals.
SOL/BTC Market: Price Remains at the Downside
When compared with Bitcoin, the Solana price is still below the 9-day and 21-day moving averages. Meanwhile, a daily close above the resistance level of 1800 SAT could encourage the bulls to extend the rally towards 2200 SAT and above. In other words, a close below the lower boundary of the channel could reverse the Solana price direction towards the daily support at 1500 SAT.
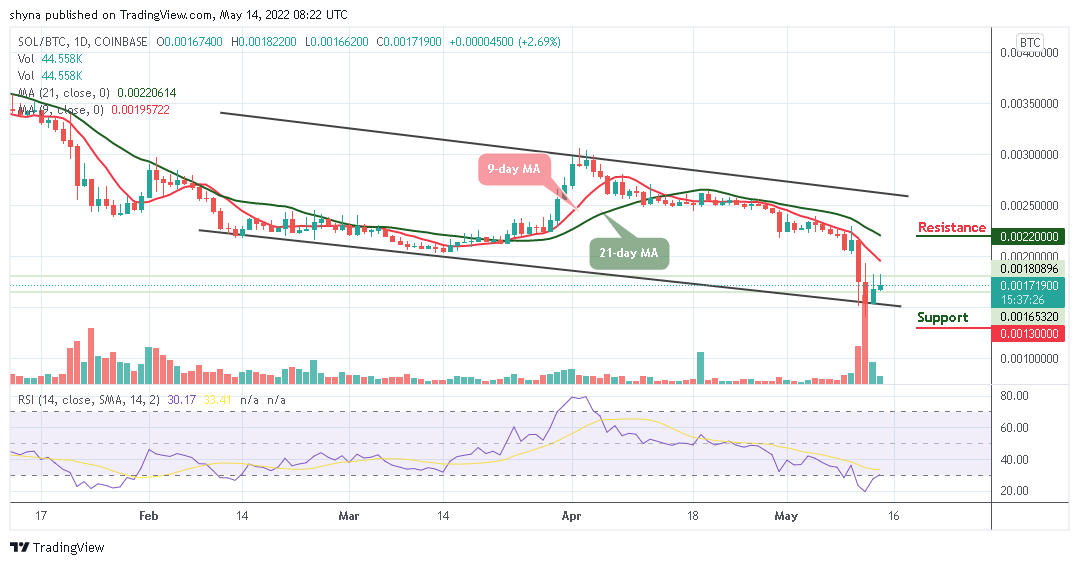
However, any further bearish movement could take the coin to the support of 1300 SAT and below. Meanwhile, there is a possibility that SOL/USD may continue the bullish trend as the technical indicator Relative Strength Index (14) is likely to cross above the 30-level with the signal line facing up to indicate bullish movement.
Join Our Telegram channel to stay up to date on breaking news coverage