Join Our Telegram channel to stay up to date on breaking news coverage
Solana Price Prediction – August 17
A long-holding of the SOL/USD market operation below the $50 resistance line has degenerated into the situation, seeing the crypto’s price retraces in ranges as of the moment. The market is trading between $44.71 and $41.06 at an average rate of -418%.
Solana (SOL) Statistics:
SOL price now – $41.31
SOL market cap – $14.4 billion
SOL circulating supply – 348.8 million
SOL total supply – 511.6 million
Coinmarketcap ranking – #9
SOL/USD Market
Key Levels:
Resistance levels: $50, $60, $70
Support levels: $25, $20, $15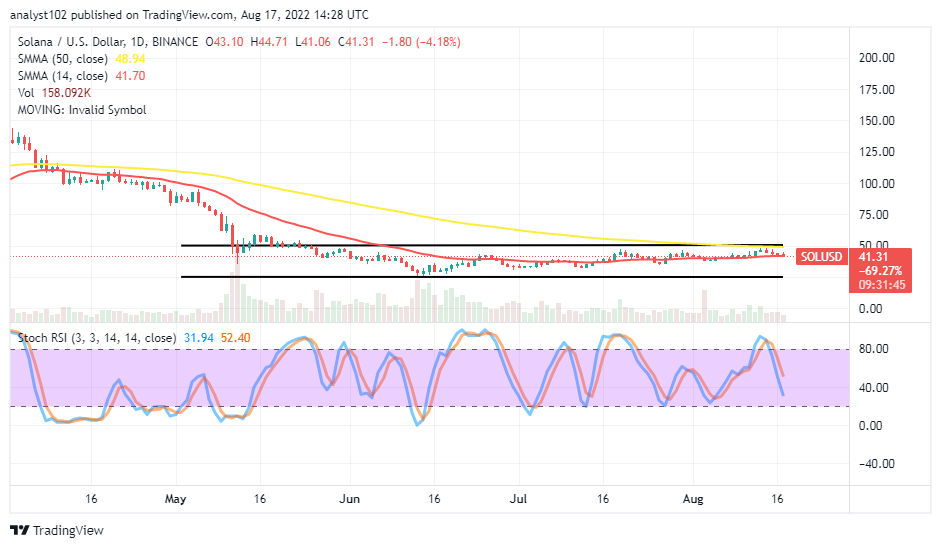 SOL/USD – Daily Chart
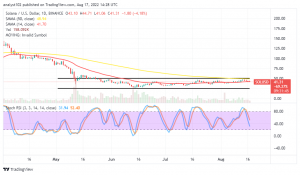
The SOL/USD daily chart showcases the crypto market retraces in ranges after averaging the $50 resistance trading level recently. The upper range line is drawn at the value line, and the lower range line drew at the $25 support level. The 14-day SMA trading indicator is at $41.70, slightly beneath the $48.94 point of the 50-day SMA indicator. The Stochastic oscillators have crossed southbound to 52.40 and 31.94 range value lines, indicating that a downward force is on the motion at a low-pushing pace.
Your capital is at risk.
Will the SOL/USD market hold the range-bound zones for some time?
The SOL/USD market may hold the range-bound zones over some time as the crypto economy retraces in ranges of $50 and $25. Buying orders may have to regain stances after a line of pull-downs may have got exhausted closely below the 14-day SMA. To observe an early technically ideal buying pattern, the price needs to show signs of bounce-offs from a lower-trading spot toward the lower range line before reconsidering buying orders.
On the downside of the technical analysis, the SOL/USD market bears may less actively be pushing northward against the trend line of the 14-day SMA. Even though the current trading outlook still suggests a prevalence of bearish-trending motions on a lower-trending force, which is not too ideal to leverage a selling order on at the moment. Therefore, traders may need to stay off the market for a while until another round of formation tends to occur at their range spots.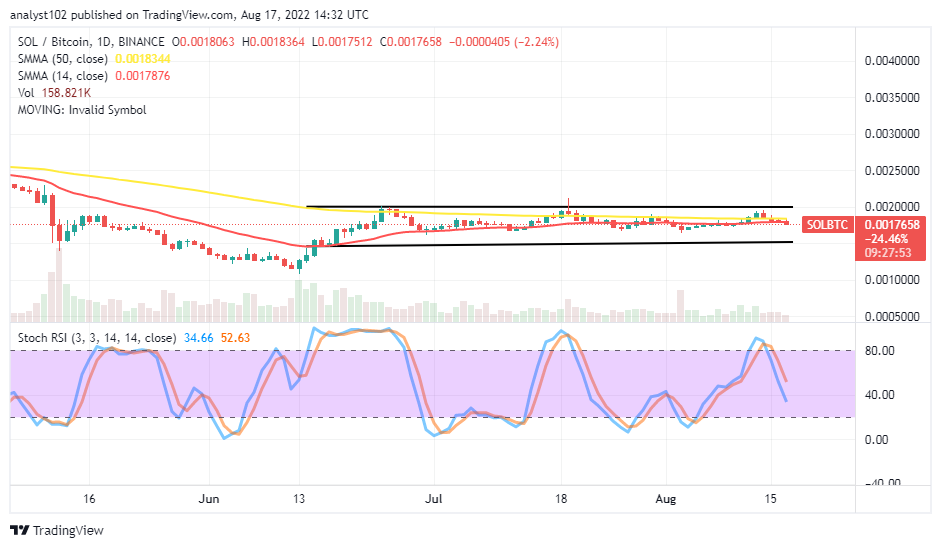
SOL/BTC Price Analysis
In comparison, Solana has held the trading situation between it and Bitcoin to a smaller length of higher-trading zones around the trend lines of the SMAs. The 14-day SMA indicator closely trends eastward below the 50-day SMA indicator within the upper horizontal and the lower horizontal lines drawn to ascertain the range-bound that the market has been pushing. The Stochastic Oscillators have crossed southbound to 52.63 and 34.66 range points. Their positioning indicates that the base crypto is yet under a depression pairing with its counter-trading crypto.
Read more:
Join Our Telegram channel to stay up to date on breaking news coverage