Join Our Telegram channel to stay up to date on breaking news coverage
The Solana price prediction shows that SOL is beginning to restart the uptrend after trading below the moving averages.
Solana Prediction Statistics Data:
- Solana price now – $44.73
- Solana market cap – $15.4 billion
- Solana circulating supply – 348.374 million
- Solana total supply – 511.6 million
- Solana Coinmarketcap ranking – #9
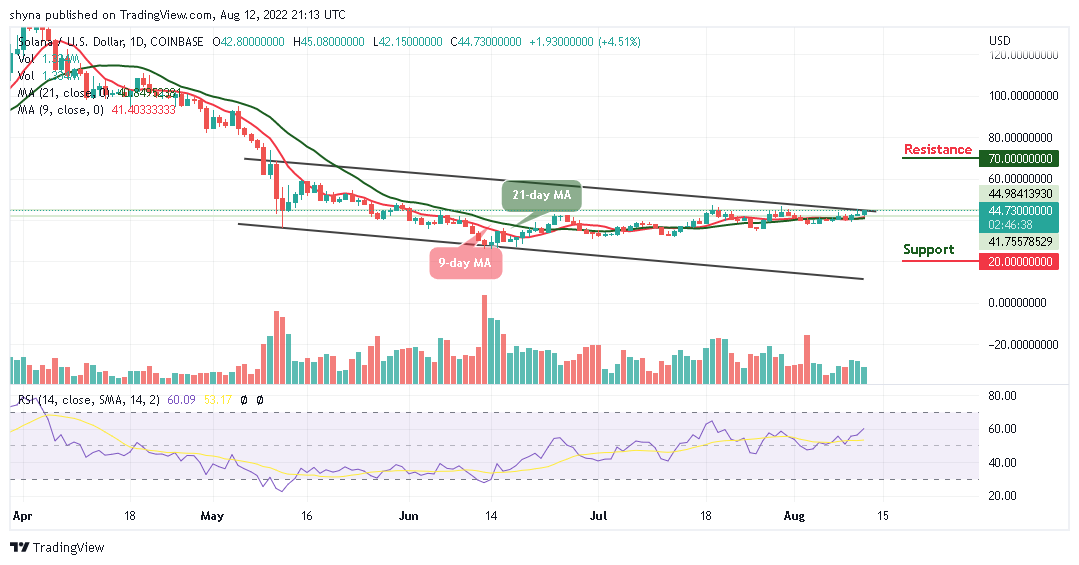
SOL/USD Market
Key levels:
Resistance Levels: $70, $75, $80
Support Levels: $20, $15, $10
Your capital is at risk.
SOL/USD looks green today as the price hovers above the resistance level of $44 and a daily close above the $45 level may increase the Solana price to the $50 resistance level. However, traders should note that a consistent price increase may bring more buyers into the market as bulls increase their positions.
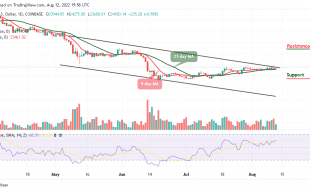
Solana Price Prediction: Price May Begin to Break Higher
In the past few days, after the Solana price crossed above the 9-day moving and 21-day moving averages, SOL/USD is now looking forward to breaking above the upper boundary of the channel. Moreover, the daily chart reveals that if the coin breaks to the upside, it will push the coin to the upside.
Meanwhile, the bears may take advantage and bring the coin below the moving averages if the bulls fail to move the price upward. Meanwhile, the technical indicator Relative Strength Index (14) is likely to cross above the 60-level. More so, if the Solana price stays above the moving averages, it could hit the resistance levels of $70, $75, and $80 but facing the south may bring the price to the supports at $20, $15, and $10.
SOL/BTC Market: Price Remains at the Downside
Against Bitcoin, the Solana price is hovering above the 9-day and 21-day moving averages. However, intraday trading is ranging as the coin moves to cross above the upper boundary of the channel, which could reach the resistance level at 2500 SAT and above.
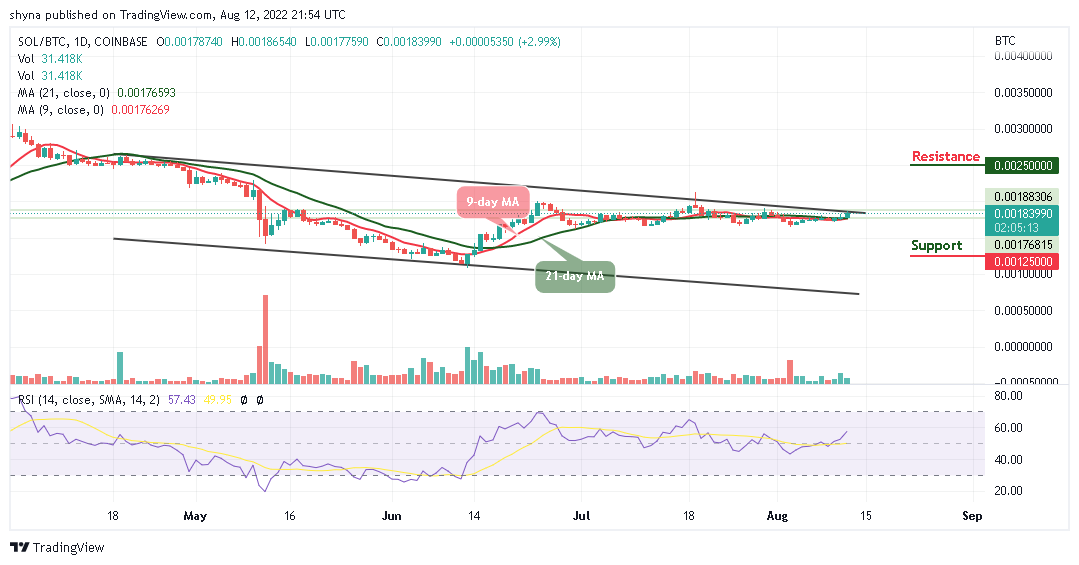
On the contrary, if the sellers bring the market to the south, traders can expect a fall below the moving averages, breaking below this barrier may hit the support at 1250 SAT and below. Meanwhile, the technical indicator Relative Strength Index (14) moves to cross above the 60-level, suggesting more bullish signals.
Related
Join Our Telegram channel to stay up to date on breaking news coverage