Join Our Telegram channel to stay up to date on breaking news coverage
The Solana price prediction shows that SOL slides below $39 today as the coin may enter deeply into the negative side.
SOL Prediction Statistics Data:
- SOL price now – $38.5
- SOL market cap – $13.3 billion
- SOL circulating supply – 346.3 million
- SOL total supply – 511.6 million
- SOL Coinmarketcap ranking – #9
SOL/USD Market
Key Levels:
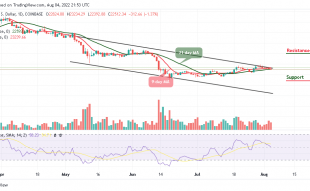
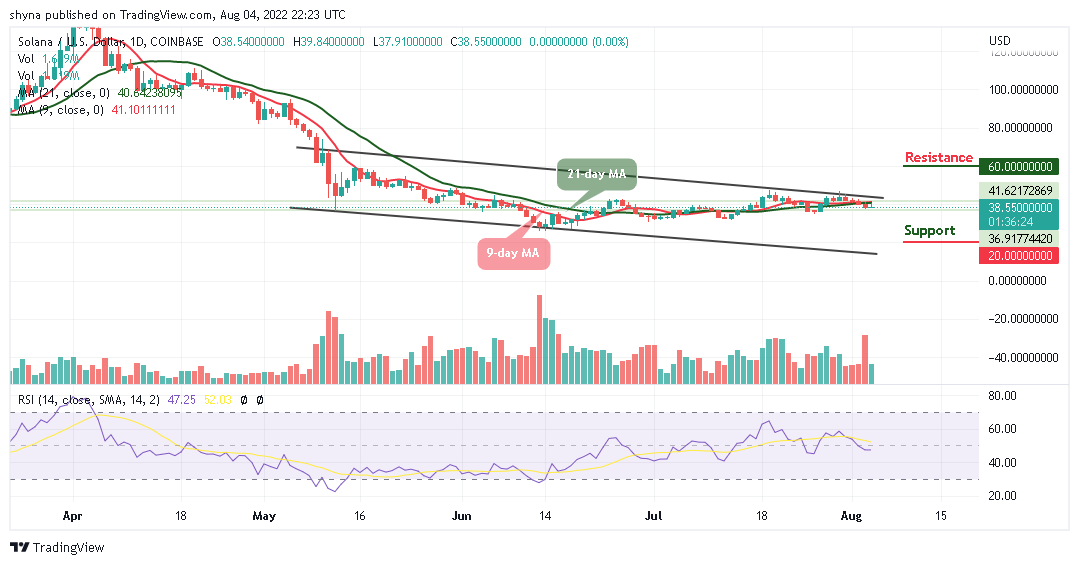
Resistance levels: $60, $65, $70
Support levels: $20, $15, $10
SOL/USD is moving sideways as bears could step back into the market. At the time of writing, SOL/USD is hovering below the 9-day and 21-day moving averages, while the trend has a bearish inclination, which could touch the support at $35.
Solana Price Prediction: Will SOL see a Further Downside?
As the daily chart reveals, the best bulls can do is to defend the support at $38 and focus on pulling towards $40. A few days ago, the Solana price is seen following a downward movement as the sharp drops affected the buyers from an attempted recovery above $38. However, if buying pressure increases, the price may break above the 9-day and 21-day moving averages and could reach the resistance at $40.
Nevertheless, if the coin crosses above the upper boundary of the channel, a bullish continuation could reach the resistance levels of $60, $65, and $70 respectively. In other words, if the coin moves toward the negative side, a minimum swing could bring the price to a $30 level. Exceeding this level could take the bears to $20, $15, and $10 support levels.
Against Bitcoin, the daily chart reveals that bulls may push the price towards the north, but the most recent negative sign suggests that the trend could follow the downtrend as buyers were unable to keep the price above the upper boundary of the channel.
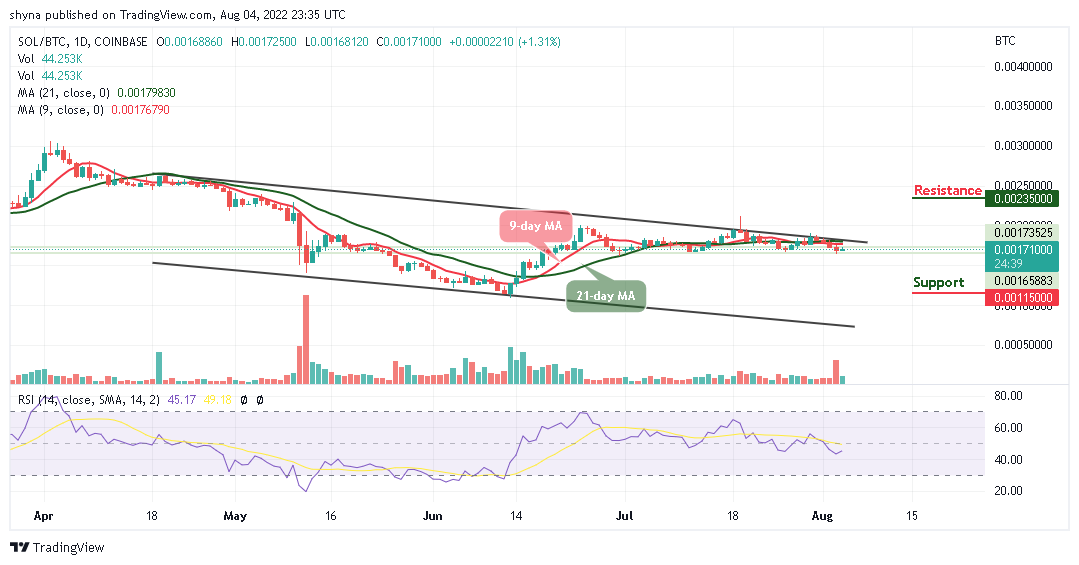
However, as the technical indicator Relative Strength Index (14) slides below the 50-level, it may likely head to the downside, and a bearish continuation could lower the price to the support levels of 1150 SAT and below, but once it moves above the channel, the market price may likely begin an upward trend to push the coin towards the resistance level of 2350 SAT and above.
Join Our Telegram channel to stay up to date on breaking news coverage