
Join Our Telegram channel to stay up to date on breaking news coverage
The Bitcoin price prediction shows that BTC may fall below the moving averages if it touches the support of the $22,000 level.
Bitcoin Prediction Statistics Data:
- Bitcoin price now – $22,512
- Bitcoin market cap – $430.9 billion
- Bitcoin circulating supply – 19.1 million
- Bitcoin total supply – 19.1 million
- Bitcoin Coinmarketcap ranking – #1
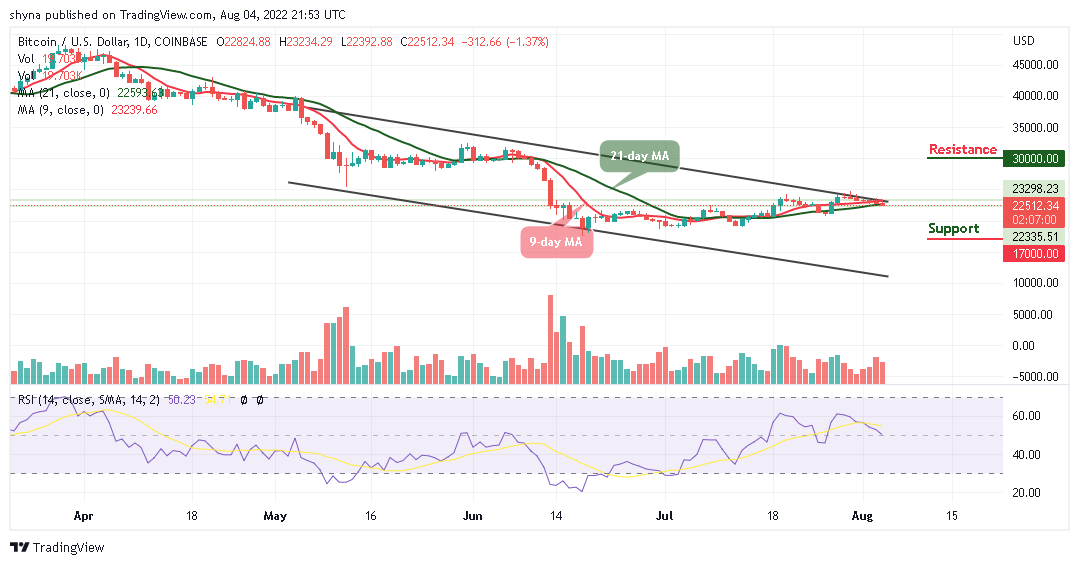
BTC/USD Long-term Trend: Bearish (Daily Chart)
Key levels:
Resistance Levels: $30,000, $32,000, $34,000
Support Levels: $17,000, $15,000, $13,000
The daily chart reveals that BTC/USD may claim more support as the king coin moves within the descending channel with the current consolidation pattern. More so, as the coin fails to cross above the upper boundary of the channel, BTC/USD may likely see a sharp drop towards the lower boundary of the channel. However, the first level of support may be located at $22,000. Beneath this, other supports lie at $17,000, $15,000, and $13,000.
Bitcoin Price Prediction: Bitcoin (BTC) May Head to the South
According to the daily chart, the Bitcoin price has failed to break above the resistance level at $23,000, the king coin may set up another few days of negative price declines beneath $22,000. A break above the previous level would have set Bitcoin up to retest the $24,000 level. Meanwhile, the technical indicator Relative Strength Index (14) may head to the south.
Today, the Bitcoin price touches the daily low of $22,392 but now dropping to create another support level below the 9-day and 21-day moving averages. However, it does look like bears may end up closing below this support. On the contrary, if the coin moves toward the upside, resistance levels could be located at $30,000, $32,000, and $34,000.
BTC/USD Medium-term Trend: Ranging (4H Chart)
The 4-hour chart shows that the Bitcoin bulls are likely to step back into the market by pushing the BTC price to cross above the 9-day and 21-day moving averages. Although the Bitcoin price has not yet slipped below $22,000 in the last few hours, it’s still in the loop of making a bounce back.
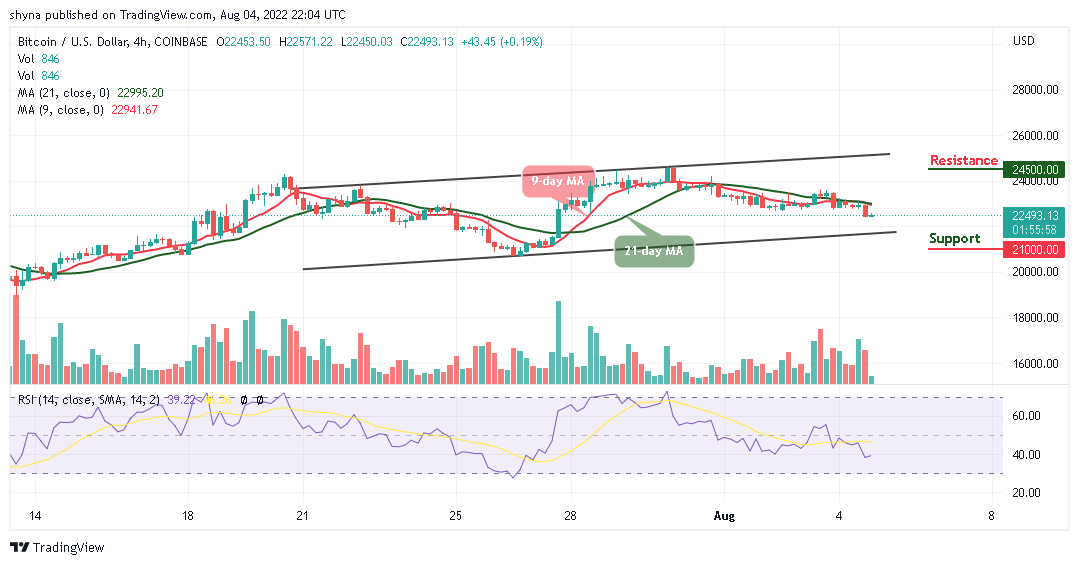
At the moment, BTC/USD is currently moving below the moving averages. The upward movement may likely push the price nearest resistance at $24,500 and above while the immediate support lies at $21,000 and below. The technical indicator Relative Strength Index (14) is moving to cross above the 40-level, suggesting that the market may head to the north.
Read more:
- How to buy Bitcoin
- How to buy Cryptocurrency
Join Our Telegram channel to stay up to date on breaking news coverage