Join Our Telegram channel to stay up to date on breaking news coverage
Serum (SRM) Price Prediction – August 9
The valuation of Serum goes lower highs around the trend line of the 14-day SMA over several days of operations. For the last seven days, the crypto market has been trading between the low and high-value lines of $0.93 and $1.11. And its percentage rate is at a 0.51negative.
Serum (SRM) Price Statistics:
SRM price now – $1.01
SRM market cap – $266.9 million
SRM circulating supply – 263.24 million
SRM total supply – 1.1 billion
Coinmarketcap ranking – #124
Serum (SRM) Market
Key Levels:
Resistance levels: $1.25, $1.50, $1.75
Support levels: $0.75, $0.55, $0.35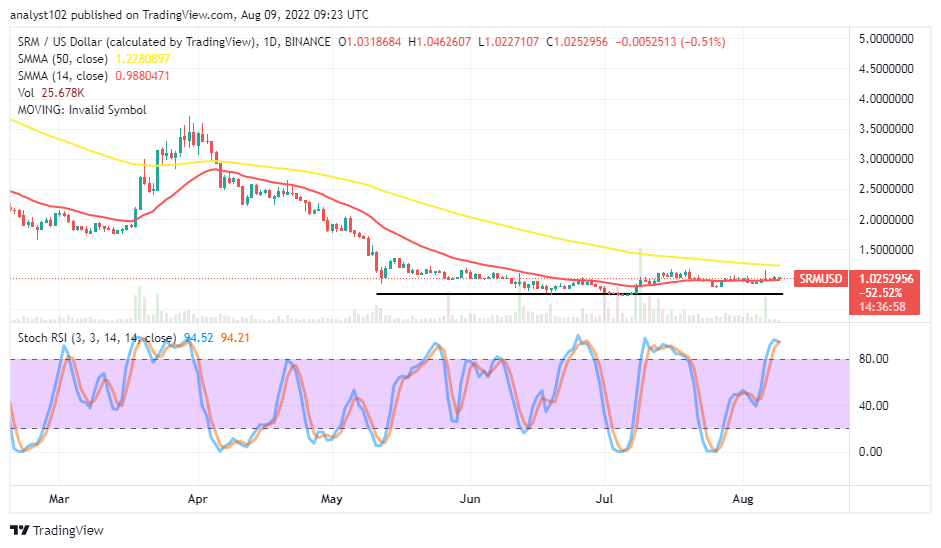
The SRM/USD daily chart reveals the crypto market goes lower-highs at the 14-day SMA trend line underneath the 50-day SMA indicator. The smaller SMA indicator is at $0.9881, below the $1.2281 of the bigger SMA indicator. The horizontal line drew at the $0.75 support level to show where the critical baseline has occurred over time. The Stochastic Oscillators have penetrated the overbought region. And they have closed the lines to signal the possibility of the market relaxing soon.
Will the SRM/USD market push higher to at least reach the 50-day SMA value line at $1.2281 afterward?
It may take a while before the price gets to the $1.2281 resistance point, even if the SRM/USD market bulls will have to consolidate their presence as the crypto goes lower highs at the 14-day SMA presently. As the trading outlook portends, buyers may find new buying entries hard as the upward movement in the market may systemically degenerate into a lesser-active mode to the upside. But, investors have to stick to the idea of buying and holding.
On the downside of the technical analysis, the SRM/USD market bears may now apply the reading of either 1-hour or 4-hour chart to determine when price tends to decline from an overbought region before considering a selling order at an early stage. Short-position placers should be wary of a sustainable fearful breakout of resistance points such as $1.2281 and $1.50. If those value lines have to experience many ups to stay over for some time, it can lead to a change of trend to favor bulls in the long run.
SRM/BTC Price Analysis
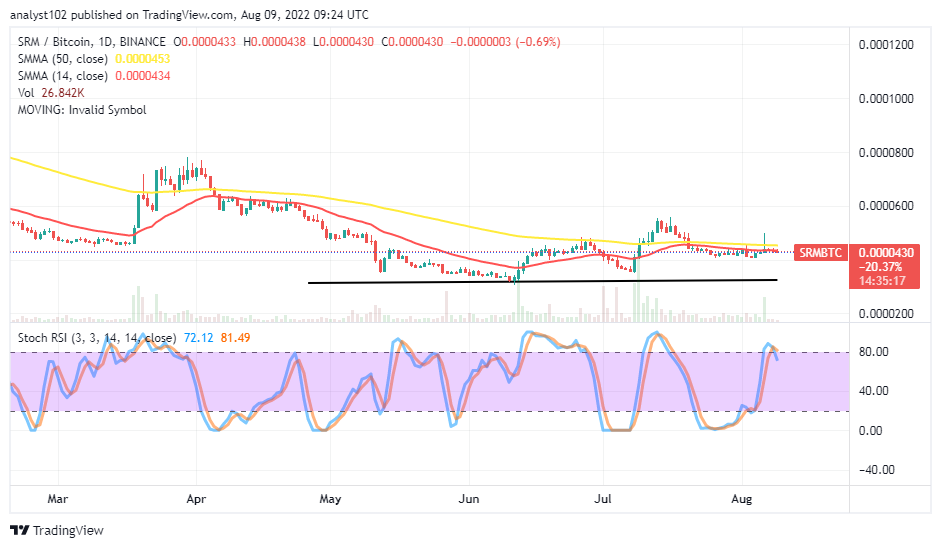
Serum’s trending capacity against Bitcoin has been holding a promissory bullish-moving mote on the daily price analysis chart. The cryptocurrency pair price goes lower at highs at the 14-day SMA trend line. Barely four days ago, the pairing cryptos made a fake surge, passing through the SMAs. But, it couldn’t sustain it on the same day, as the trade reversed back to the area of the smaller SMA. The Stochastic Oscillators have slightly crossed southbound from the range of 80. It shows the base crypto may take time before it can continue to push to the north side against its counter-trading crypto.
Read more:
Join Our Telegram channel to stay up to date on breaking news coverage
