
Join Our Telegram channel to stay up to date on breaking news coverage
Serum (SRM) Price Prediction – July 13
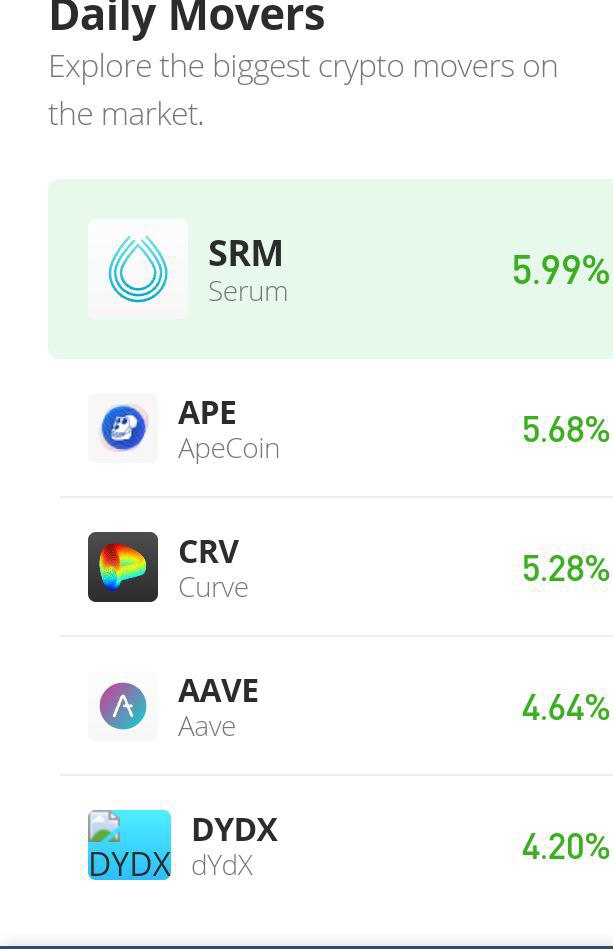
The SRM/USD market valuation keeps highs above the 14-day SMA trend line on the buying signal side. In the last seven days’ operations, the price has been trading between the low and high values of $0.75 and $1.06. The crypto’s rate of percentage is 7.27 positives.
SRM Price Statistics:
SRM price now – $1.04
SRM market cap – $273.1 million
SRM circulating supply – 263.24 million
SRM total supply – 1.1 billion
Coinmarketcap ranking – #100
Serum (SRM) Market
Key Levels:
Resistance levels: $1.25, $1.50, $1.75
Support levels: $0.75, $0.55, $0.35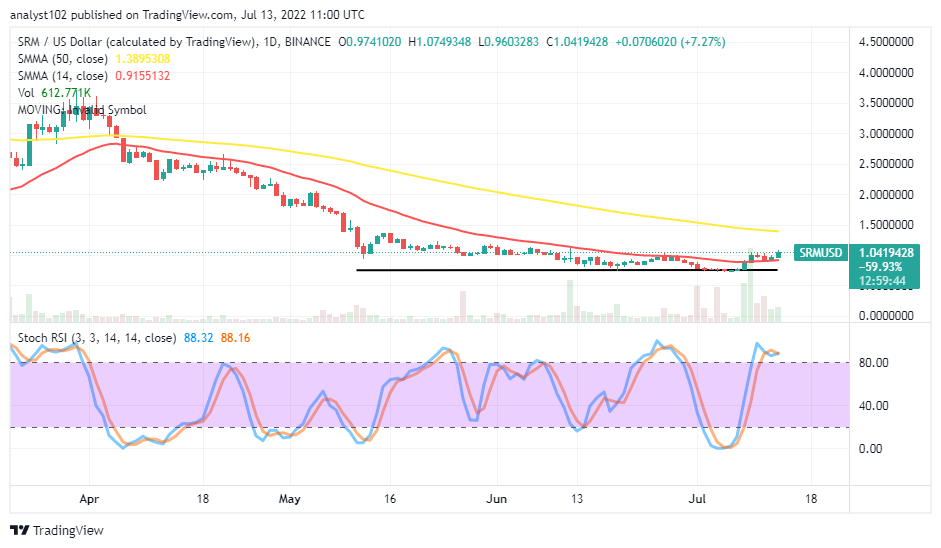 SRM/USD – Daily Chart
The SRM/USD daily chart showcases the crypto economy keeps high above the smaller SMA trend line. The 50-day SMA indicator is over the 14-day SMA indicator. The horizontal line drew to mark the baseline serving the present swing highs at the $0.75 support level. The Stochastic Oscillators are in the overbought region. And they have conjoined the lines within. That shows, with an emergence of a bullish candlestick in the making, the base trading instrument may consolidate into higher levels than its current trading spot in the near time.
Will the SRM/USD market maintain more highs over the 14-day SMA?
Indicators suggest the SRM/USD market may maintain more highs as the crypto-economic price keeps highs above the 14-day SMA trend line. It may now be technically advisable that traders needed to exercise patience in their launching of new buying orders at the moment. Long-position takers should be wary of price possibly running into a correction as it has noticed that it is now trading under an overbought condition.
On the downside of the technical analysis, at the time of writing the analytical write-up, the probability of the SRM/USD market bears gaining back control is dicey. Short-position placers must wait for the price to encounter resistance around $1.38 or thereabout, as indicated by the 50-day SMA indicator. Based on that assumption, sellers will be patient until the market shows an active reversal motion before launching a sell order.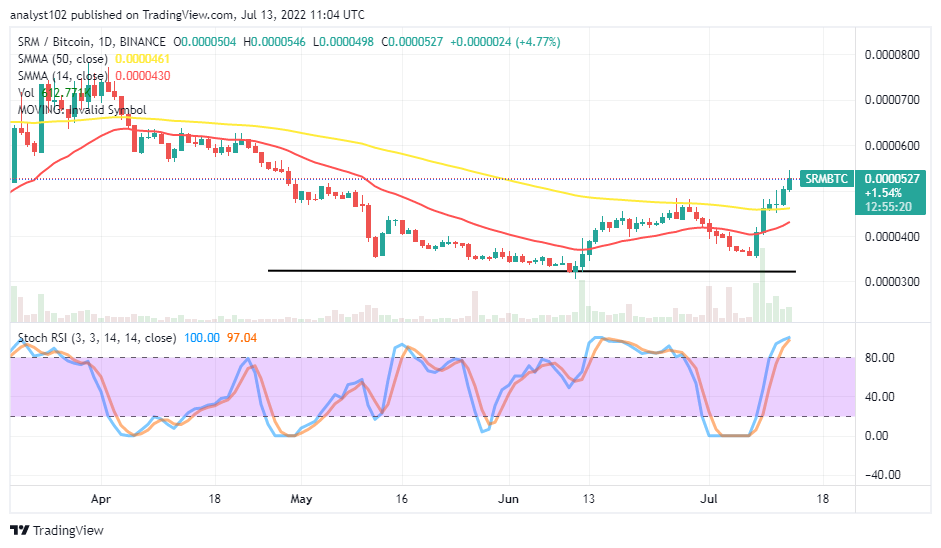
SRM/BTC Price Analysis
There has now been a significant trending pressure in the Serum market operations against Bitcoin. The cryptocurrency pair price keeps highs above the SMA trend lines. The 14-day SMA indicator is underneath the 50-day SMA indicator. The Stochastic Oscillators are in the overbought region, slightly pointing toward the north. It shows that the counter-trading crypto may not push back against the base crypto. If a bearish candlestick eventually emerges at a high resistance point to engulf the penultimate bullish candlesticks around the spot, it can be that price has reached its peak. So, a correction may take place afterward.
Read more:
Join Our Telegram channel to stay up to date on breaking news coverage