Join Our Telegram channel to stay up to date on breaking news coverage
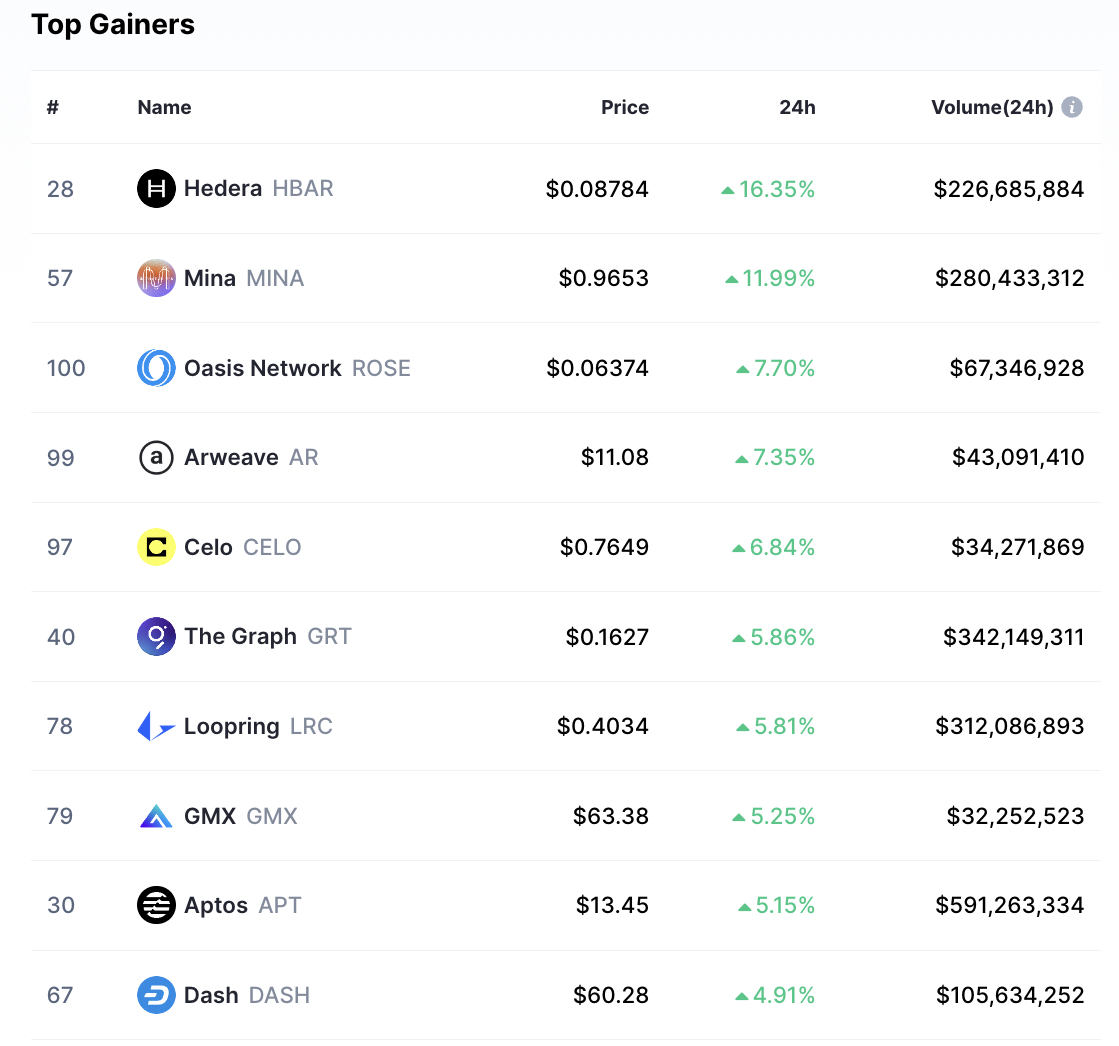
The Oasis Network token (ROSE) is among the cryptos leading the gains at the start of the trading weekend on Saturday. The ROSE price has climbed 7.7% in the past 24 hours to trade at $0.639. With a 24-hour trading volume of approximately $67.4 million, the token has attained a live market cap of $366 million placing at position 100 according to the ranking by CoinMarketCap.
Among the top 10 gainers today is Hedera (HBAR) which is leading the top park with 16.35% gains. Second is Mina (MINA) which is up 12% on the day to exchange hands at $0.9563. Closing the top 5 are Arweave (AR) and Celo (CELO) which have rallied 7.35% and 6.84% over the same timeframe. See the chart below for more gainers.
ROSE Price Needs To Flip $0.067 Back To Support
The $0.033 support floor provided a launching pad for the ROSE bulls to initiate a recovery. The Oasis Network token then went on to record a series of higher highs and higher lows leading to the formation of an ascending parallel channel on the daily timeframe.
The price attempted to rise above the channel’s resistance line on February 8, but this turned out to be a bull trap as traders booked profits on the rally to $0.072. At the time of writing, the ROSE token was trading within the confines of the ascending channel at $0.0639. As long as the price remained trading within this channel, it was set to continue rising.
For this to happen, however, the ROSE price must produce a sustained break above the channel’s upper boundary at $0.067. If this happens, it would provide the tailwinds required to push the price toward the $0.076 local high.
Higher than that, the buyers may attempt another upward move to confront resistance from the $0.08 psychological level, before reaching the $0.086 major resistance level. Traders could expect ROSE’s upside to be capped here, in the near term.
ROSE/USD Daily Chart
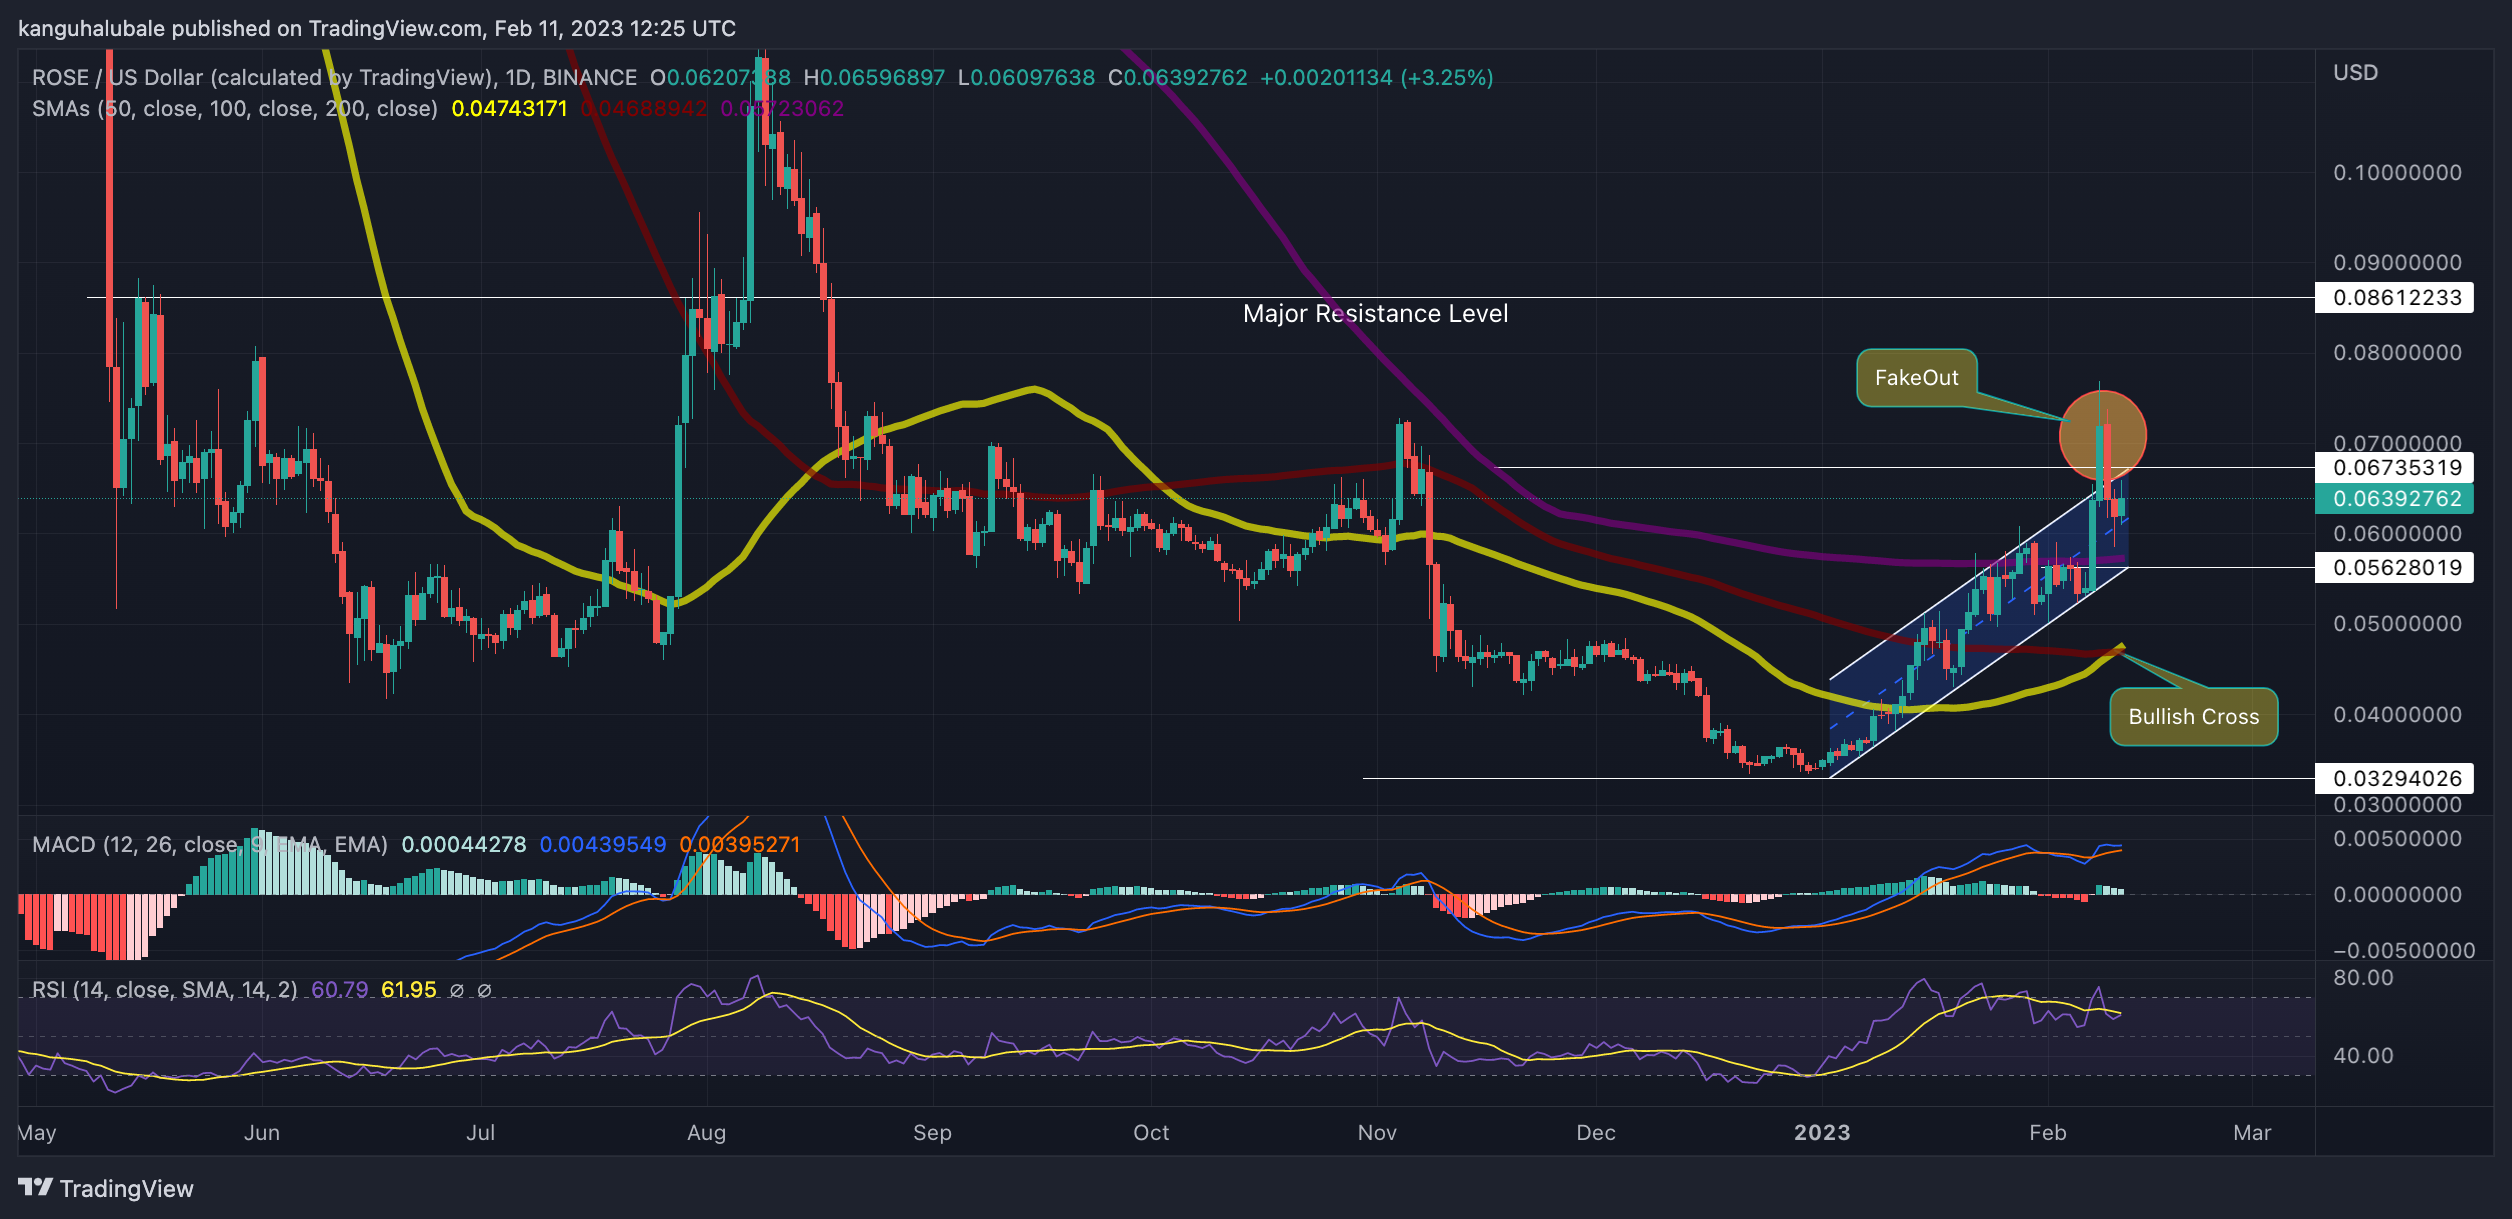
Apart from the bullish technical formation, the moving averages have sent a bullish signal on the same daily chart, supporting the bullish narrative for the Oasis Network token. This came in the form of a bullish cross that happened when the 50-day Simple Moving Average ((SMA) crossed above the 100-day SMA on Friday.
In addition, the Relative Strength Index (RSI) was facing upward toward the overbought territory. The price strength at 60 suggested that the buyers were currently stronger than the sellers and were focused on pushing ROSE higher.
Moreover, the Moving Average Convergence Divergence (MACD) was moving above the zero line in the positive region. This showed that the Oasis Network market still favored the upside. Note that the call to buy ROSE which was sent on February 7 when the MACD line crossed above the signal line was still intact.
However, a daily candlestick close below the 200-day SMA at $0.057 or the lower boundary of the prevailing chart pattern at $0.056 would trigger massive sell orders that could see the price plummet. The first point of breathing would be the $0.05 psychological level or the $0.047 area where the 50-day and 100-day SMAs appeared to converge.
In highly bearish cases, the ROSE price may drop lower to revisit the swing low at $0.033. Such a move would completely invalidate the bullish thesis.
More News:
- Metropoly Beta 2.0 Launch on Feb 10 Revs up the METRO Presale
- Play-to-Earn Platform Meta Masters Guild Kicks Through $4 Million Raised in Presale – Next Stage Price Hike Imminent!
- Loopring Price Soars 28% To $0.446 – Where Next LRC?
- How to Buy Cryptocurrencies
Join Our Telegram channel to stay up to date on breaking news coverage