Join Our Telegram channel to stay up to date on breaking news coverage
XRP Price Prediction – March 26
As the Ripple (XRP) is trading within this range, we can assume that it is currently neutral. However, the momentum is with the bulls and we can expect the range to likely break toward the upside.
XRP/USD Market
Key Levels:
Resistance levels: $0.19, $0.21, $0.23
Support levels: $0.13, $0.11, $0.09
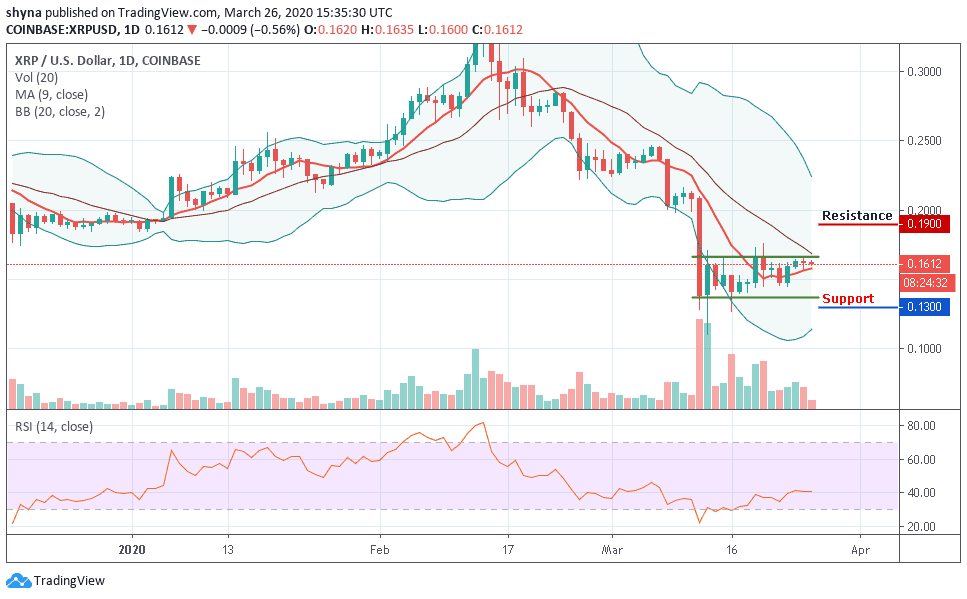
Looking at the daily chart, XRP/USD is still demonstrating a sign of weakness across its markets. Now, the Ripple market is down by 0.56%, reflecting a price drop in the market and the fall might become heavy if the bearish action continues. The coin has now found some form of stabilization as it has managed to trade above the $0.16 level for the past straight 4-days of trading, however, the momentum is still clearly within the bullish favor and we should expect this to rise higher rather than to drop further.
Meanwhile, the third largest-cryptocurrency witnessed a bearish drive against USD yesterday but currently trading at $0.161. Therefore, since the XRP/USD is following a sideways movement on a short-term outlook as it has been revealed by RSI (14) indicator, traders may expect the trend to break above the upper limit of the channel if the price actions still remain above the 9-day moving average.
Moreover, a channel breakout may likely strengthen the bulls and this could push the price to the resistance levels of $0.19, $0.21 and $0.23 or a channel breakdown might lead the market in a bearish scenario if the price continues to fades and the closest supports to keep an eye on are $0.13, $0.11, and $0.09.
Comparing with Bitcoin, the Ripple price is changing hands at 2439 SAT and it is currently trading within the channel. XRP/BTC may likely break above the 9-day moving average because the technical indicator suggests that the price may go higher as RSI (14) moves toward the 40-level. The nearest resistance levels lie at 2600 SAT and above.
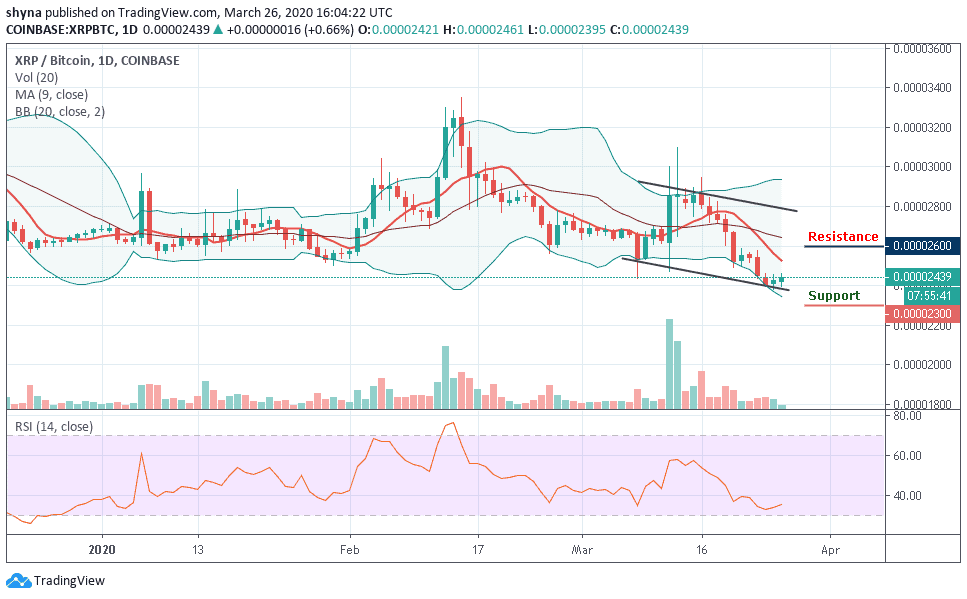
Moreover, the fact that a bearish pattern was created inside a significant support area increases the possibility that it may likely initiate a reversal. Meanwhile, if the bulls could not push the price above the 9-day moving average, the coin could reach the nearest support levels at 2300 SAT and beyond.
Please note: Insidebitcoins.com is not a financial advisor. Do your research before investing your funds in any financial asset or presented product or event. We are not responsible for your investing results.
Join Our Telegram channel to stay up to date on breaking news coverage