Join Our Telegram channel to stay up to date on breaking news coverage
Bitcoin (BTC) Price Prediction – March 26
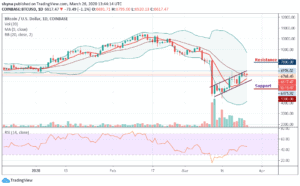
Despite the push north, there is still somewhat a risk to the downside, given a bearish flag structure.
BTC/USD Long-term Trend: Bullish (Daily Chart)
Key levels:
Resistance Levels: $7,800, $8,000, $8,200
Support Levels: $5,300, $5,100, $4,900
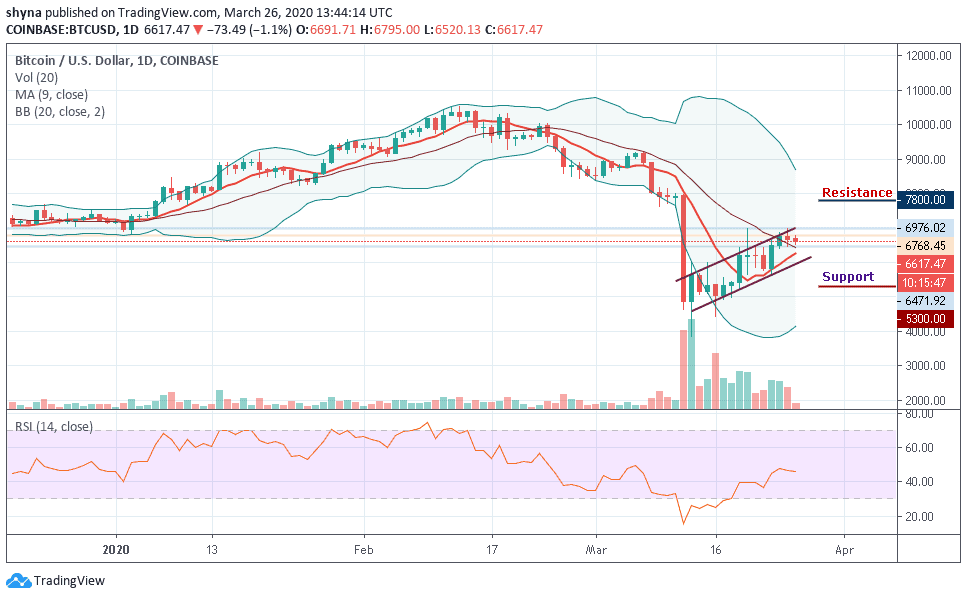
BTC/USD is vulnerable to losses likely to test $5,500 as long as it stays under the critical $7,000 zone. The Bitcoin (BTC) price could make a downturn back to $5,500 before a formidable recovery is achieved. At the time of writing, BTC/USD is doddering at $6,604 following a minor upward advancement from $6,768 which is today’s high value. Meanwhile, the volatility is low while BTC/USD remains largely in the hands of the bulls.
Moreover, as the coin is trading at $6,604 and displays an intraday loss of 1.3%. The prevailing movement is bearish with expanding volatility. The leader of cryptocurrencies currently consolidates in a bullish flag pattern. Meanwhile, a breakout out from this pattern is supposed to continue in the direction of the previous trend. In this case, we expect BTC/USD to rise above $7,000 resistance and could move towards the potential resistance levels at $7,800, $8,000 and $8,200.
However, should Bitcoin price failed to remain above the 9-day moving average; the price could drop to $6,000 vital support. A further low drive could send the price to $5,300, $5,100 and $4,900 support. The RSI (14) has recently revealed a sign of trend reversal, which shows a possible more bearish momentum, may continue to play out.
BTC/USD Medium-Term Trend: Ranging (4H Chart)
At the opening of the market today, the Bitcoin price first went up but has dropped slightly within 24 hours, bringing its price from $6,708 to reach around $6,639. Should the price continue to drop further and move below the channel, it could reach the nearest support levels at $6,200, $6,000 and $5,800.
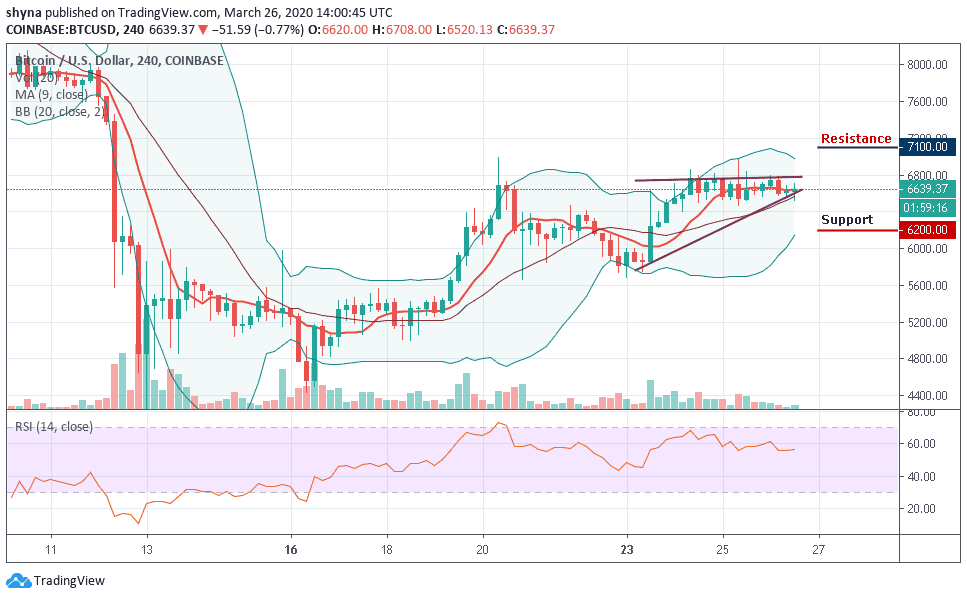
Meanwhile, if the bulls push the coin above the 9-day moving average, the price of Bitcoin may likely reach the potential resistance levels of $7,100, $7,300 and $7,500. Presently, the market is indecisive as the RSI (14) indicator moves around 55-level.
Please note: Insidebitcoins.com is not a financial advisor. Do your research before investing your funds in any financial asset or presented product or event. We are not responsible for your investing results.
Join Our Telegram channel to stay up to date on breaking news coverage