Join Our Telegram channel to stay up to date on breaking news coverage
Ripple Price Prediction – June 23
The Ripple price is rising with a gain of 13.72% over the past 24 hours as it rises above the $0.60 level.
XRP/USD Market
Key Levels:
Resistance levels: $0.90, $0.95, $1.00
Support levels: $0.20, $0.15, $0.10
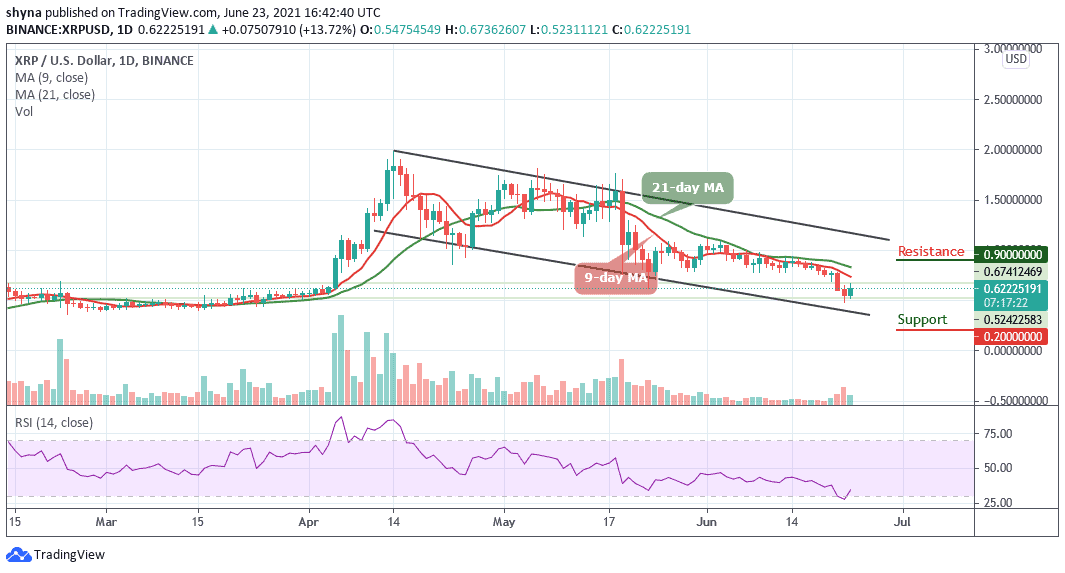
XRP/USD is now holding strong above $0.60 and this level has been supporting the market since a few days ago. Moreover, it could be possible that the more the resistance level of $0.60 is tested, the more it is likely to break higher. On the other hand, if the Ripple price crosses below the lower boundary of the channel, traders could expect the market price to break beneath and this may likely test the critical support levels of $0.20, $0.15, and $0.10.
Ripple Price Prediction: What Could Be the Next Direction for Ripple?
According to the daily chart, the Ripple price is hovering around $0.62 with a slightly bullish movement towards the 9-day and 21-day moving averages. However, should in case the bulls put more pressure on pushing the Ripple price above the resistance levels at $0.90, $0.95, and $1.00. Moreover, the technical indicator Relative Strength Index is beginning to recover from the oversold region as the signal line crosses above 30-level. However, the bulls may remain in control until a larger divergence to the upside is noticed.
Comparing with Bitcoin, the Ripple price has been trading slowly below the 9-day and 21-day moving averages. After bottoming out around the 1641 SAT level, the price begins to slowly ascend and is currently trading around the 1861 SAT. However, the Ripple price is now contained within the channel as traders wait for the bulls to hopefully push the price above the 9-day and 21-day moving averages.
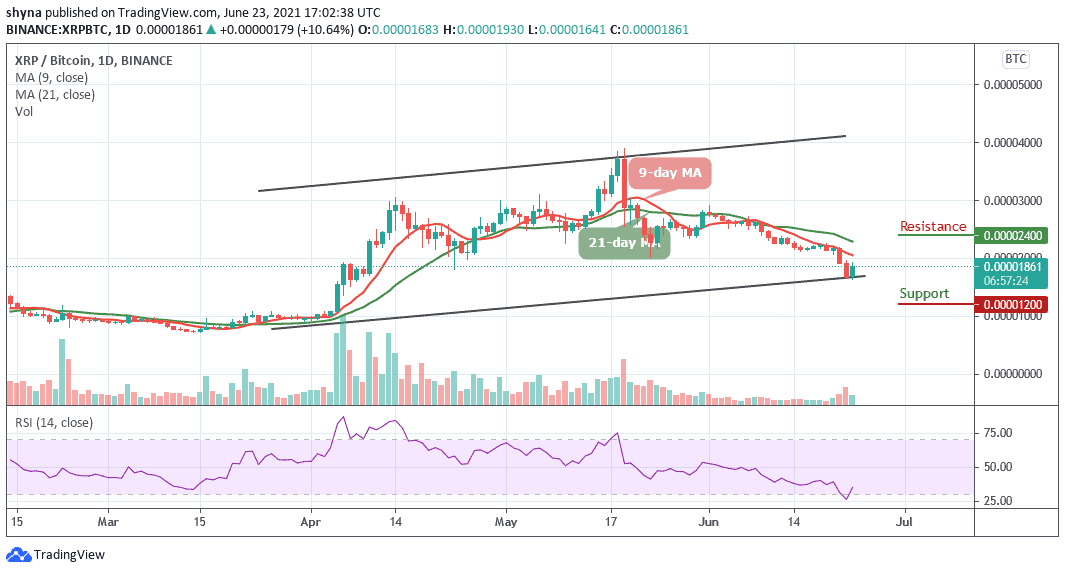
On the upside, if the bulls can break above the 9-day and 21-day MAs, traders can expect initial resistance at 2300 SAT. Above this, higher resistance is located at 2400 SAT and above. Alternatively, If the sellers push the market below the lower boundary of the channel, XRP/USD may hit the critical support at 1200 SAT and below. Meanwhile, the Relative Strength Index (14) is moving away from the oversold condition to cross above 30-level and it’s likely to follow a bullish movement.
Looking to buy or trade Ripple (XRP) now? Invest at eToro!
75% of retail investor accounts lose money when trading CFDs with this provider
Join Our Telegram channel to stay up to date on breaking news coverage