Join Our Telegram channel to stay up to date on breaking news coverage
Ripple Price Prediction – June 21
The Ripple price has been down by more than 13.07% in the last 24 hours; the value has gone below $0.70.
XRP/USD Market
Key Levels:
Resistance levels: $1.05, $1.15, $1.25
Support levels: $0.35, $0.25, $0.15
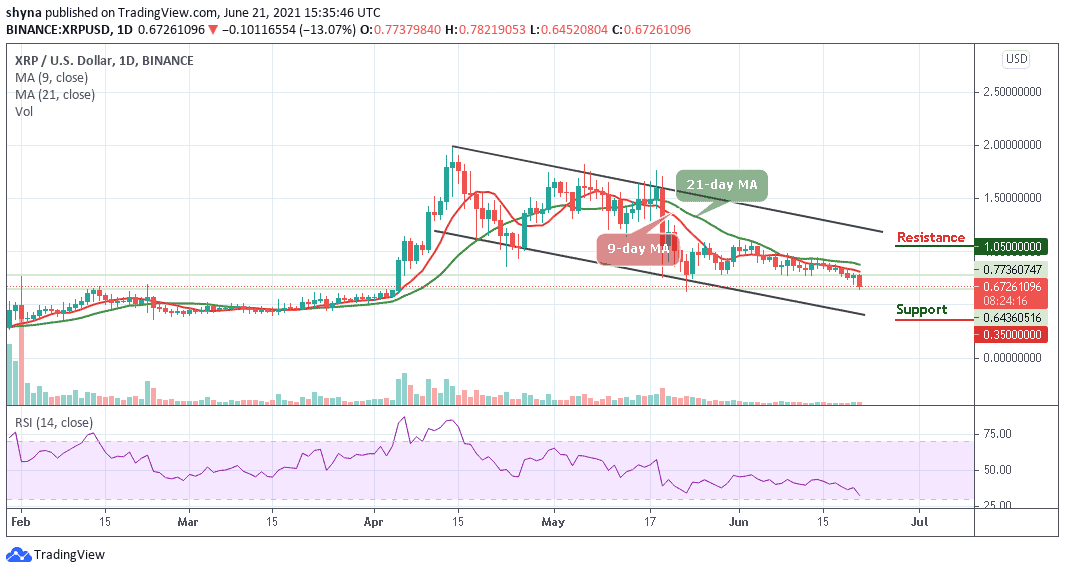
XRP/USD is currently facing a bearish move and its current dilapidated condition can be attributed to the overall gloomy market. More so, both the 9-day and 21-day moving averages are above the current price, suggesting a delay in reaching a trend reversal. Meanwhile, a breakout in the channel will likely give the market enough strength to dig deeper, but the rise could lead the Ripple market into a bullish scenario.
Ripple Price Prediction: Where Could Ripple Price Go Next?
According to the daily chart, the Ripple price is moving within a descending channel under the 9-day and 21-day moving averages. However, looking at it technically, the channel formation is a bearish flag pattern that mostly followed a break-down in price. Therefore, following the past few days of price actions, XRP/USD is consolidating at the middle boundary of the channel. Currently, the Ripple price is bearish but a bounce-back above the 9-day and 21-day moving averages may locate the resistance levels at $1.05, $1.15, and $1.25.
Moreover, a price break-down below the lower boundary of the channel may occur as bears may find new lows at $0.35, $0.25, and $0.15 support levels. More so, from a long-term perspective, the Ripple (XRP) is still in a dominant bearish bias as the technical indicator Relative Strength Index (14) is heading below 35-level preparing to cross into the oversold region. Furthermore, if the Ripple price continues to oscillate downward, it may likely create a new low around the $0.40 support level.
When compares with Bitcoin, the Ripple (XRP) is moving above the 9-day and 21-day moving averages around the lower boundary of the channel. Meanwhile, the sellers are trying to push the price below the channel and the bearish continuation could bring it to the support level of 1400 SAT and below.
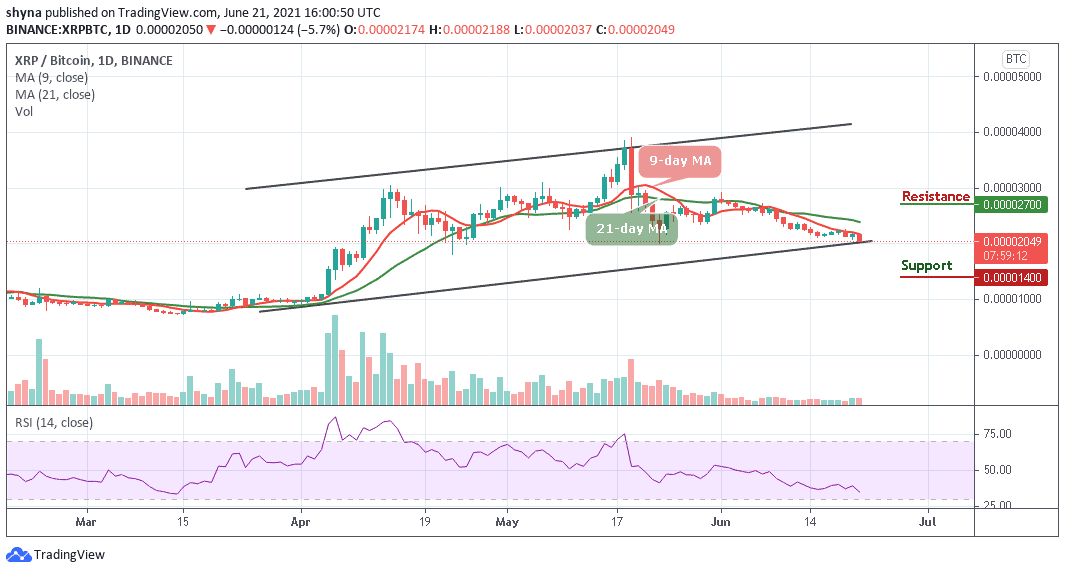
However, if the Ripple bulls can regroup and push the market above the 9-day and 21-day moving averages, a possible rise could take the market to the resistance levels of 2700 SAT and 2800 SAT. According to the technical indicator Relative Strength Index (14), the signal line is moving below 40-level, which suggests that more bearish movements are coming to play out.
Looking to buy or trade Ripple (XRP) now? Invest at eToro!
75% of retail investor accounts lose money when trading CFDs with this provider
Join Our Telegram channel to stay up to date on breaking news coverage