Join Our Telegram channel to stay up to date on breaking news coverage
XRP Price Prediction – May 4
Ripple has traced an impulse pattern over the last 4 hours as the coin recently recovered from beneath.
XRP/USD Market
Key Levels:
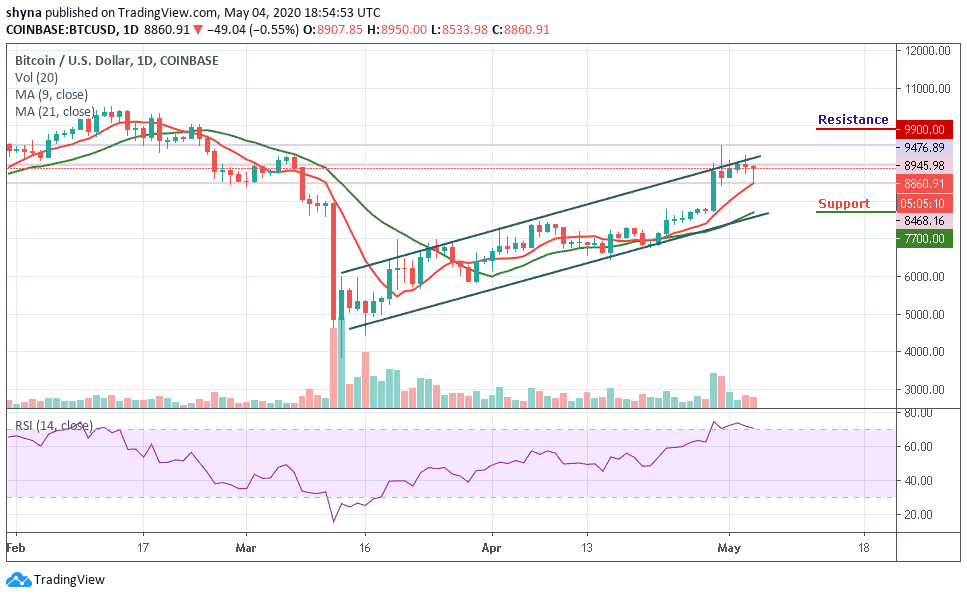
Resistance levels: $0.25, $0.26, $0.27
Support levels: $0.19, $0.18, $0.17
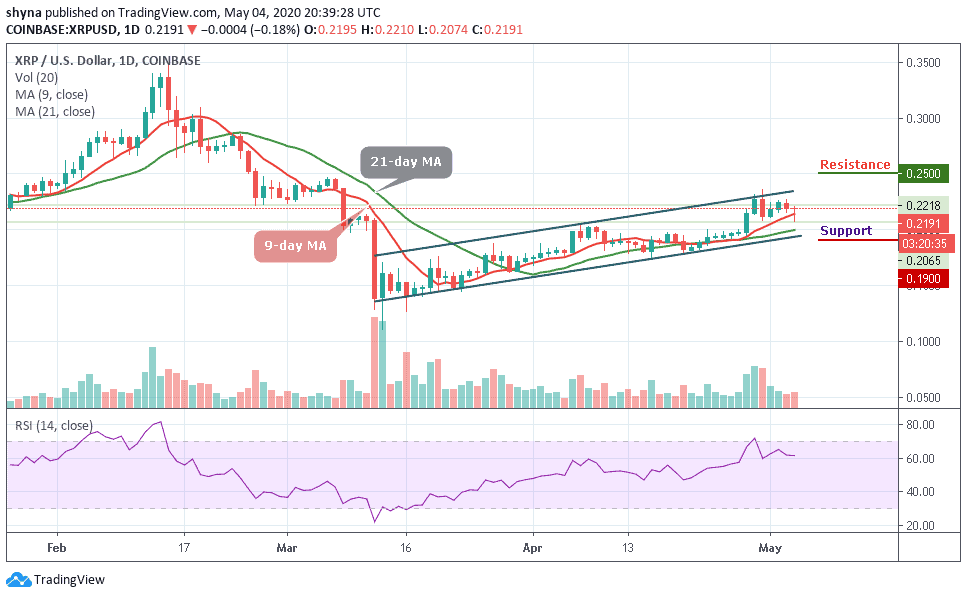
XRP/USD has not been able to cross above the channel to pace up its price as it trades below major support levels today. Even though the chart shows volatility, XRP/USD has crossed $0.23 price level for only once, in the last week. A few hours ago, Ripple recovered from trading beneath by trading above the 9-day and 21-day moving averages.
However, a sustainable move below $0.20 support level can be interpreted as a strong bearish signal. This level could serve as a buffer that separates the Ripple (XRP) from an extended decline towards the support levels of $0.19, $0.18, and $0.17. In other words, for the upside, the buyers may need to make a sustainable move above $0.22 as soon as possible to halt the sideways movement.
Nevertheless, for the upside to gain traction, the coin needs to regain ground above $0.24, while $0.25, $0.26, and $0.27 resistance levels are the ultimate aims for the bulls. More so, the Relative Strength Index (RSI (14) suggests that the coin may start following the sideways movement before deciding on the next direction.
When compared with Bitcoin, XRP is still trading on the downside, although the price action has remained intact within the channel. If the selling pressure persists, the variation in price to buy Ripple may likely create a new low in the coming days. For now, the RSI (14) is still within the oversold zone; we may see a negative move in the market soon.
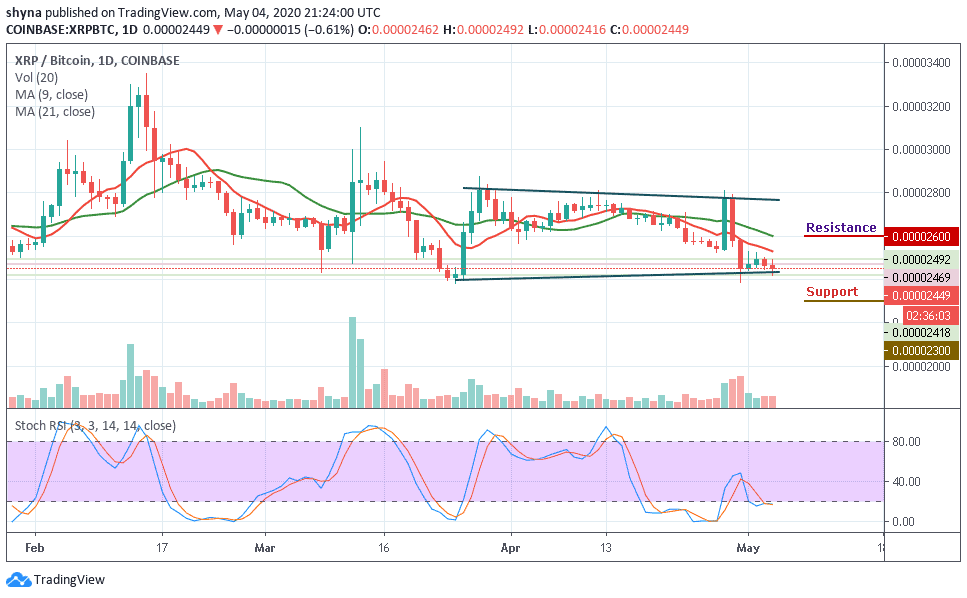
However, the coin is currently trading below the 9-day and 21-day moving average at 2449 SAT. We can expect close support at the 2400 SAT before breaking to 2350 SAT and critically 2300 SAT levels. If a bullish move occurs and validates a break above the moving averages; we can then confirm a bull-run for the market and the closest resistance levels lie at 2600 SAT and above.
Please note: Insidebitcoins.com is not a financial advisor. Do your research before investing your funds in any financial asset or presented product or event. We are not responsible for your investing results.
Join Our Telegram channel to stay up to date on breaking news coverage