Join Our Telegram channel to stay up to date on breaking news coverage
Bitcoin (BTC) Price Prediction – May 4
Today, the Bitcoin price loses traction after hitting $9,000; losses likely to continue in the near term.
BTC/USD Long-term Trend: Bullish (Daily Chart)
Key levels:
Resistance Levels: $9,900, $10,100, $10,300
Support Levels: $7,700, $7,500, $7,300
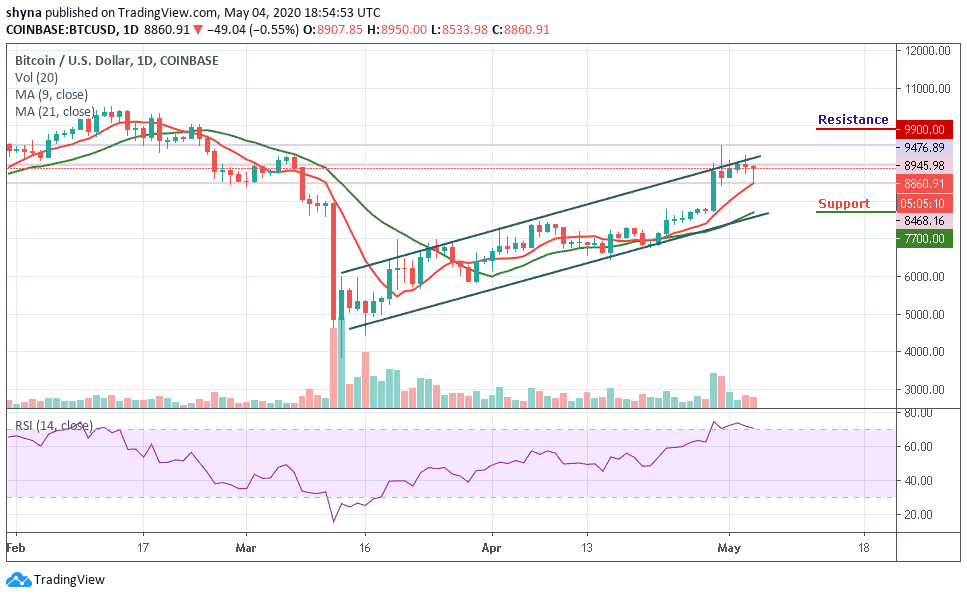
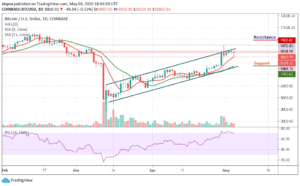
Looking at the daily chart, it can be easily seen that the market is back in the red zone as BTC/USD is posting minor losses of 0.55% on the day after commencing the trading at $8,945. It has an intraday high of $9,000; although the world’s largest crypto touches the support level of $8,468 before going back to where it is currently trading at $8,860.
However, Bitcoin just plunged below $8,894 one more time, marking $8,468 as the current daily low at the moment. Does this mean that Bitcoin (BTC) is finally leaving the significant $9,000 level and searching for a new low? Nevertheless, looking at the declining daily volume candle, together with the steady but stable recent Bitcoin price action, it can be assumed that a stronger move may be coming up soon into the market.
Moreover, as at the time of writing, BTC/USD is struggling to maintain the $8,800 level and if the coin follows the downward trend as the RSI (14) is about leaving the overbought zone, the next supports may likely come at $7,700, $7,500 and $7,300. From the upside, by maintaining the current level $8,860 and further movement could go above the upper boundary of the ascending channel to send the price to the resistance levels of $9,900, $10,100 and $10,300 which will be well above the channel.
BTC/USD Medium-Term Trend: Ranging (4H Chart)
On the 4-Hour chart, BTC price hovers below the 9-day and 21-day moving averages around $8,861 which may take time to persistently trade above $9,000. In addition, if the bulls gather enough strength and regroup, the upward movement may be able to near the $9,400 and $9,600 resistance level.
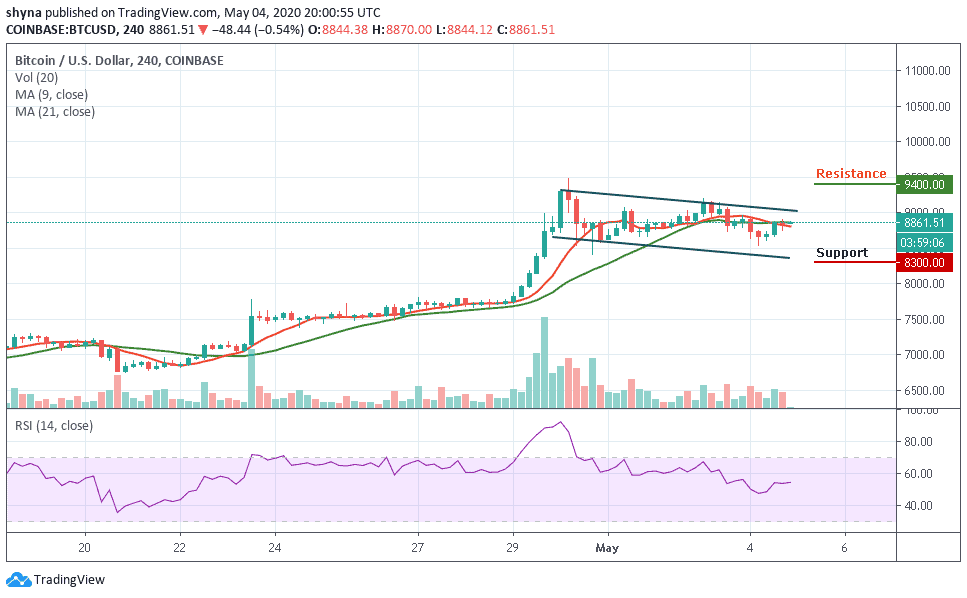
However, on the downside, immediate support is around the $8,500 level while the main support is at the $8,400 level. The price may likely fall below $8,300 if the bears step back into the market, a further movement could reach the critical support at $8,100 level. Technically, BTC/USD is still moving in sideways while the RSI (14) moves around 54-level, indicating an indecisive in the market movement.
Please note: Insidebitcoins.com is not a financial advisor. Do your research before investing your funds in any financial asset or presented product or event. We are not responsible for your investing results.
Join Our Telegram channel to stay up to date on breaking news coverage