Join Our Telegram channel to stay up to date on breaking news coverage
XRP Price Analysis – May 31
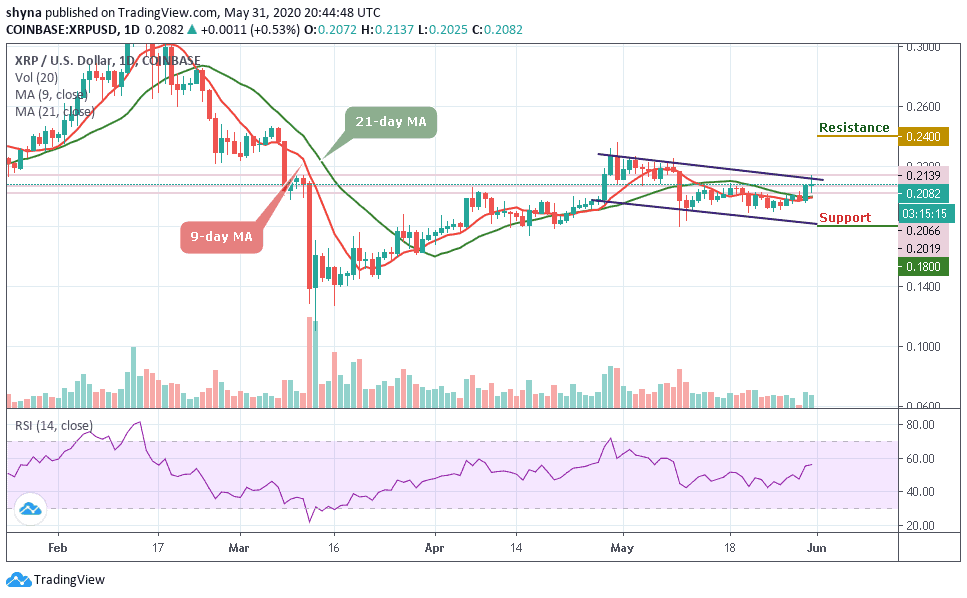
XRP/USD pair has been confined between $192 and $200 because of the inability of the bulls to break the resistance at $0.20. In the last 48 hours, XRP rebounded and the initial resistance at $0.20 was breached. The crypto has two more hurdles to jump over. That is, to jump the hurdles at $0.225 and the other at $0.235.
XRP/USD Market
Key Levels:
Resistance Levels: $0.24, $0.26, $0.28
Support Levels: $0.22, $0.20, $0.18
If you buy Ripple you might have noticed the downward move after the crypto was overbought at $0.235 price level. In the overbought region, sellers emerged to push prices down. Nonetheless, the coin has been on a downward move from the resistance levels of $0.235 to the low of $0.20. At the low of $0.20, Ripple was in a tight range between $0.192 and $0.20.
Fortunately, the bulls have broken the $0.20 resistance as price after a rebound. The market rebounded at a low of $$0.198 to break the $0.20 resistance. XRP is rising to battle the resistance at $0.225 and $0.235. On the upside, a rebound above the low of $0.22 will propel price to break through the resistance levels. Presently, Ripple is above 60% range of the daily stochastic. This explains that the market is in a bullish momentum
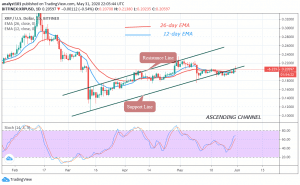
Similarly, on the XRP/BTC chart, the market is in a bearish trend. A correction candle body tested the 0.382 Fibonacci retracement level. This indicates that XRP/BTC pair will fall to a 2.618 extension level.

However, the first target will be at the 1.618 extension level. This is the first target of price reversal . However, if the selling pressure continues, the downtrend will extend to Fibonacci 2.618 extension level. Meanwhile; the pair is at level 46 of the Relative Strength Index. It indicates that price is in the downtrend zone and it is below the centerline 50. The pair is likely to fall
Please note: Insidebitcoins.com is not a financial advisor. Do your research before investing your funds in any financial asset or presented product or event. We are not responsible for your investing results.
Join Our Telegram channel to stay up to date on breaking news coverage