Join Our Telegram channel to stay up to date on breaking news coverage
XRP Price Analysis – May 31
XRP/USD needs to regain ground above $0.22 to mitigate the bearish pressure. The coin is moving within a short-term bearish trend.
XRP/USD Market
Key Levels:
Resistance levels: $0.24, $0.26, $0.28
Support levels: $0.18, $0.16, $0.14
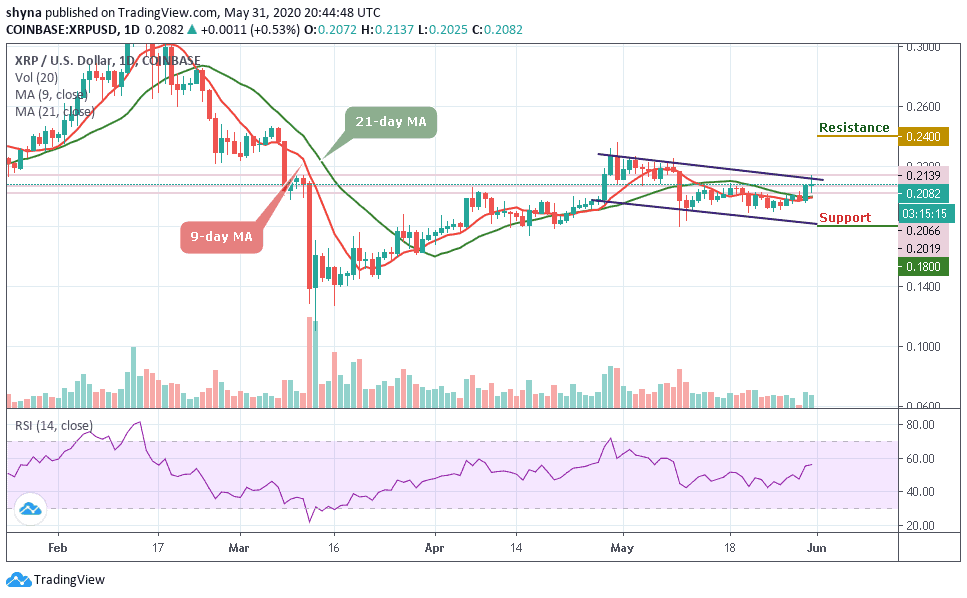
Ripple price movement is giving mixed indications. XRP/USD has already violated the immediate resistance level and is currently moving downwards. However, the price movement is quite slow and there are chances that it might end the day with a positive move. Early today, Ripple touches a high at $0.213 and the price is trading at $0.208 with 0.53% gains.
However, despite the recent downtrend on the market, the $0.200 remained a defensive level for the XRP market. Ripple’s XRP hit its lowest level of intraday at $0.201 and rebounded to $0.208 at the time of writing. Although the upward trend appears to be weak, a sustained movement over this barrier will improve the long-term technical picture of the third largest coin.
More so, a significant cross above the upper boundary of the channel could sustain the bulls to $0.22 high. Meanwhile, Ripple is currently on a downward trend and still maintaining it. If XRP manages to surge above $0.23, it may see resistance at $0.24, $0.26 and $0.28, though a further drop may take it to the support levels at $0.18, $0.16 and $0.14. The technical indicator RSI (14) is showing some bullish signals.
When compared with Bitcoin, the Ripple market price is ranging and trading above the 9-day and 21-day moving averages within the falling channel. For now, it is trading at 2192 SAT and expecting a break above the channel. Looking at the chart, both the bulls and the bears are struggling on who will dominate the market.
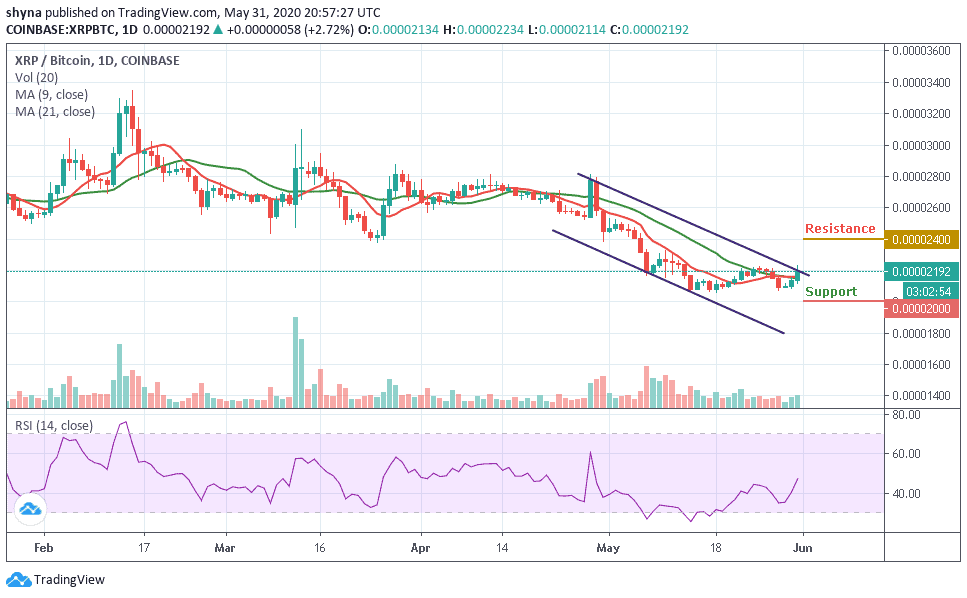
However, should the price make attempt to fall below the moving averages, the next key supports could be 2000 SAT and below. Meanwhile, on the bullish side, a possible rise could take the market to the resistance levels of 2400 SAT and 2500 SAT. According to the RSI (14), the signal line is moving towards the north, suggesting more bullish signals.
Please note: Insidebitcoins.com is not a financial advisor. Do your research before investing your funds in any financial asset or presented product or event. We are not responsible for your investing results.
Join Our Telegram channel to stay up to date on breaking news coverage