Join Our Telegram channel to stay up to date on breaking news coverage
XRP Price Analysis – June 03
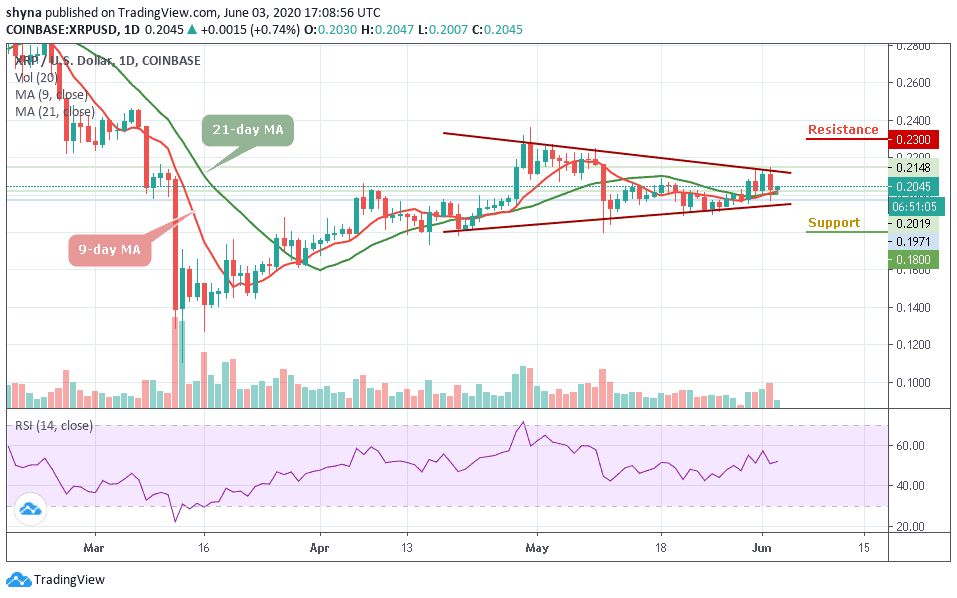
Ripple bulls broke the resistance levels of $0.20 and $0.205 and the momentum extended to the high of $0.215. There was a stiff resistance at the $0.215 price level and XRP plunged to $0.197 low. The bulls made an upward correction to trade below $0.205 resistance. Similarly, XRP/BTC is in a bear market as the coin continues its downtrend.
XRP/USD Market
Key Levels:
Resistance Levels: $0.24, $0.26, $0.28
Support Levels: $0.22, $0.20, $0.18
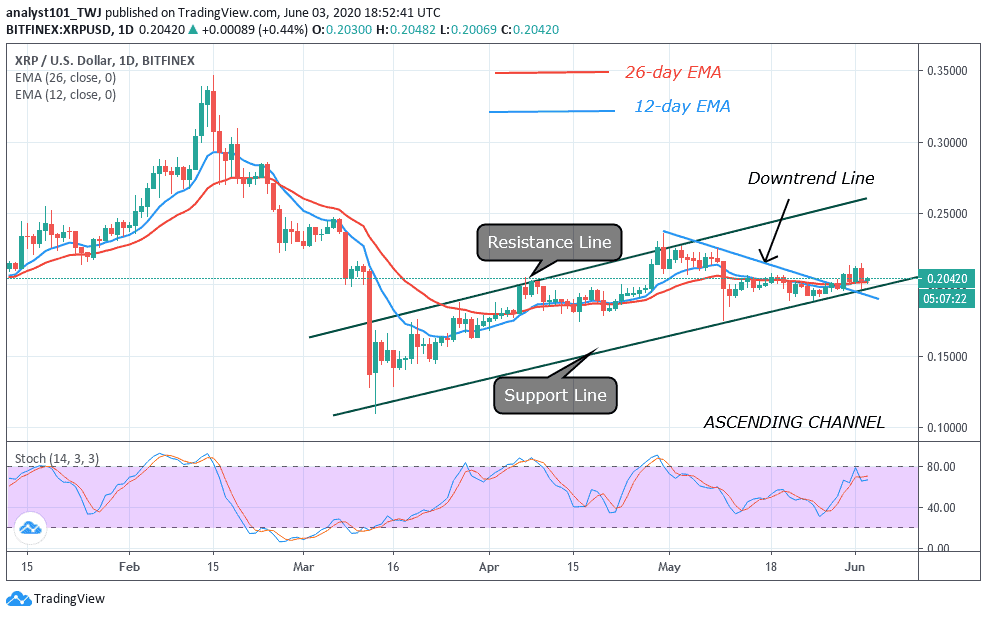
XRP/USD pair has been on a downward correction after the crypto reached the overbought region of the market. XRP has been on a gradual downward fall from the high of $0.235 to $0.20 low. Recently, XRP rebounded at the $0.195 low to break the $0.20 resistance. The momentum was insufficient to break the resistance levels of $0.215, $0.225, and $0.235. Fortunately, the coin will resume an upward move as the downtrend line has been breached.
Currently, buyers are battling to break the resistance at $0.205. On the upside, a strong bounce above $0.20 support will break the resistance levels of $0.205 and $0.215. This will accelerate price to retest the resistance at $0.225 and $0.235. Ripple will rally above $0.25 resistance when all the resistance levels are breached through a strong rebound. Presently, Ripple is below 80% range of the daily stochastic. This explains that the market is in a bearish momentum. Meanwhile, the price action is showing a bullish signal
When compared with Bitcoin, XRP/BTC is still in a downtrend. The bulls are not making efforts to push price upward. A correction candle body tested the 0.618 Fibonacci retracement level.
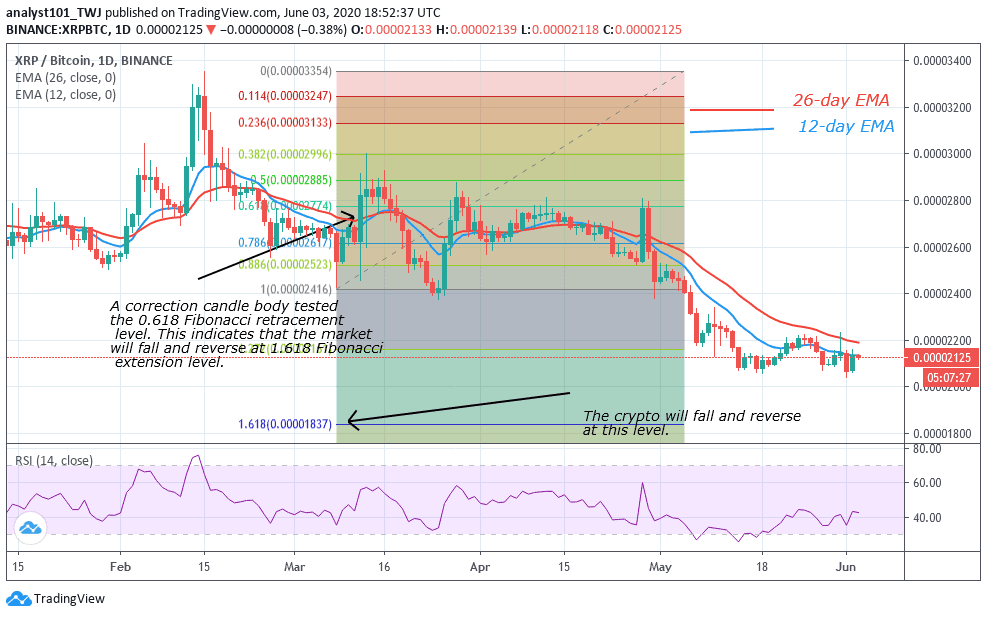
This indicates that the market will fall and reverse at 1.618 Fibonacci extension level. In other words, the crypto will reverse at Ƀ0.00001800. Presently, the market has fallen to Ƀ0.00002127 at the time of writing. The coin will reach the Fibonacci low if the selling pressure resumes. Meanwhile; the pair is at level 42 of the Relative Strength Index. It indicates the price is in the downtrend zone and it is below the centerline 50. The pair is likely to fall
Please note: Insidebitcoins.com is not a financial advisor. Do your research before investing your funds in any financial asset or presented product or event. We are not responsible for your investing results.
Join Our Telegram channel to stay up to date on breaking news coverage