Join Our Telegram channel to stay up to date on breaking news coverage
XRP Price Prediction – June 3
The Ripple (XRP) remains range-bound but can this latest bullish momentum break above the channel?
XRP/USD Market
Key Levels:
Resistance levels: $0.230, $0.240, $0.250
Support levels: $0.180, $0.170, $0.160
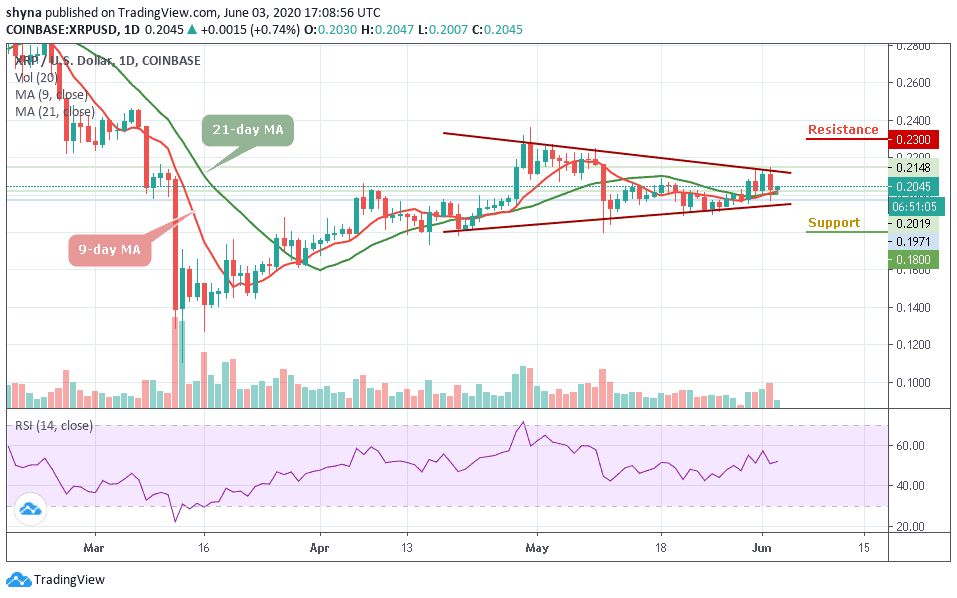
At the moment, XRP/USD is trading above the 9-day and 21-day moving averages with a small 1.5% price increase over the past 24 hours of trading as it reaches $0.204. The coin has been bouncing around within a range between $0.24 and $0.228 for the past few weeks of trading. Yesterday, XRP/USD did surge as high as $0.214 but a break out of this triangle could spark a bullish run for the coin and a push beneath the channel could spell disaster for the Ripple.
However, the price is struggling to continue above $0.204. It is currently trading within the symmetric triangle with the support near $0.200. If the price fails to stay above the $0.200 support zone, it is likely to resume its decline. Meanwhile, the first major support is near the $0.195 level, below which it could revisit the main $0.190 support. Any further losses may perhaps start a significant decline towards the $0.180, $0.170, and $0.160 support levels.
On the upside, an initial resistance is near the $0.210 level above the channel. More so, to start a fresh increase, the price must surpass the $0.210 and $0.220 resistance levels. Any further gains could lead the price towards the $0.230, $0.240, and $0.250 resistance levels. In other words, the technical indicator RSI (14) is seen moving in the same direction around the 50-level, suggesting sideways movement for the market.
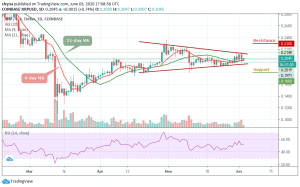
When compared with Bitcoin, the Ripple market price is ranging and trading around the 9-day and 21-day moving averages within the symmetric triangle. For now, the coin is finding it difficult to break above the channel. Looking at the chart, both the bulls and the bears are struggling on who will dominate the market as the RSI (14) moves sideways.
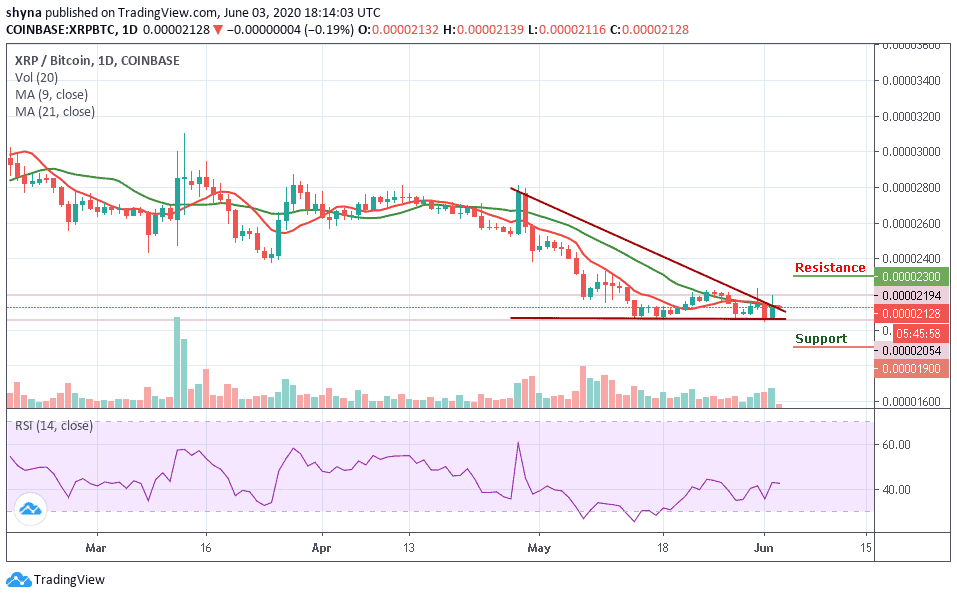
However, should the price fall below the lower boundary of the channel, the next key support level could be 1900 SAT and below. Meanwhile, on the bullish side, a possible rise may likely take the market to the resistance levels of 2300 SAT and above.
Please note: Insidebitcoins.com is not a financial advisor. Do your research before investing your funds in any financial asset or presented product or event. We are not responsible for your investing results.
Join Our Telegram channel to stay up to date on breaking news coverage