Join Our Telegram channel to stay up to date on breaking news coverage
Bitcoin (BTC) Price Prediction – June 3
BTC/USD is currently in the hands of the sellers but consolidation is likely between $9,400 and $9,600.
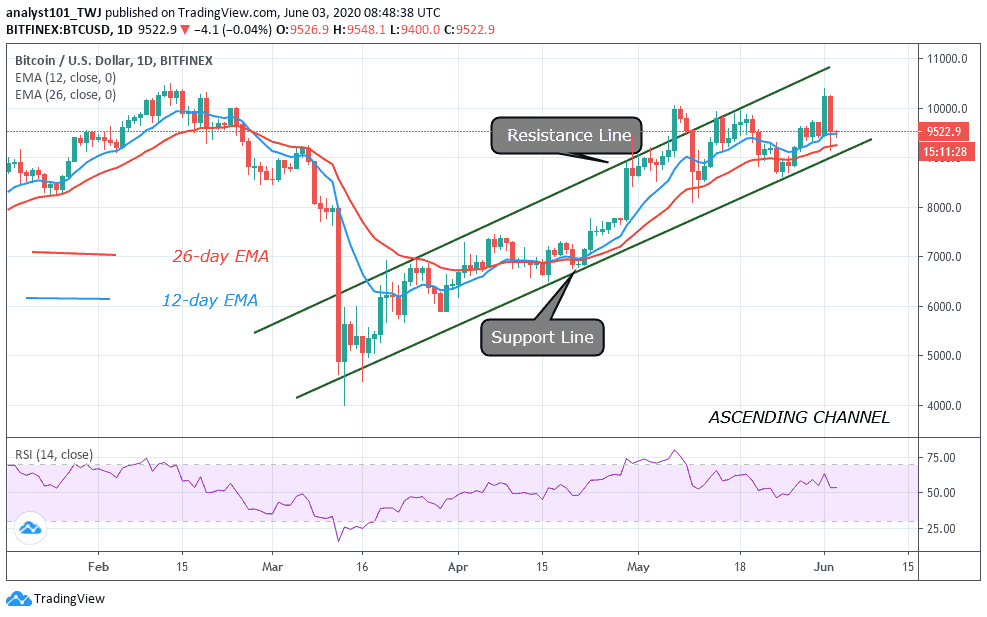
BTC/USD Long-term Trend: Bullish (Daily Chart)
Key levels:
Resistance Levels: $10,800, $11,000, $11,200
Support Levels: $8,300, $8,100, $9,900
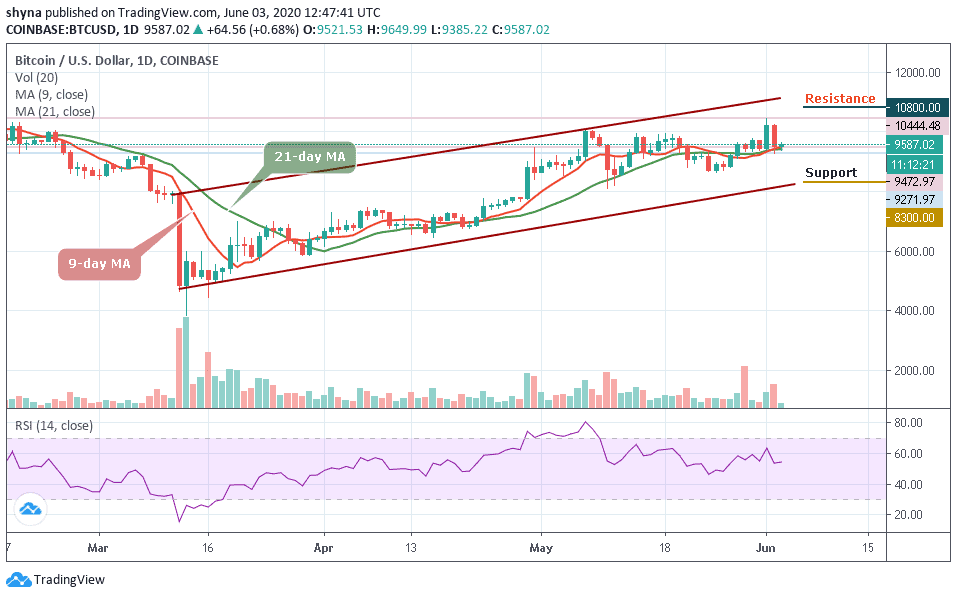
Earlier this week, BTC/USD turned heads with its majestic rise to highs above the potential $10,000 level. In fact, the number-one crypto extended its gains above $10,400. In addition, the Bitcoin price did not stay up for long because of an immediate reversal. In the early hours of yesterday, BTC/USD held on to the support above $10,000 but unfortunately, the tables were turned during the European session as Bitcoin tanked to $9,271.
Moreover, at the time of writing, BTC/USD is trading at $9,587 with a gain of 0.68% on the day. The trading is likely to remain sideways as the technical indicator RSI (14) moves in the same direction. It is important that the bulls reclaim the position above $9,500 as this would allow them to focus on higher levels towards $10,000. On the other side, continued declines under the short term support at $9,400 could easily open the way to the south.
Meanwhile, breakdown towards $9,000 is not out of the picture because the losses in the last 24 hours show that BTC/USD was not technically ready for the breakout above $10,000. Looking at the daily chart, BTC/USD is making an attempt to regain ground by moving the market price to the next level. Furthermore, any bullish movement may push the price to the resistance level of $10,800, $11,000, and $11,200 while the supports lie at $8,300, $8,100, and $7,900 respectively.
BTC/USD Medium – Term Trend: Bullish (4H Chart)
According to the 4-hour chart, the Bitcoin price first went up but has dropped slightly within 24 hours. If the price continues to drop further and move below the channel, it could reach the nearest support levels at $9,000, $8,800, and $8,600 respectively.
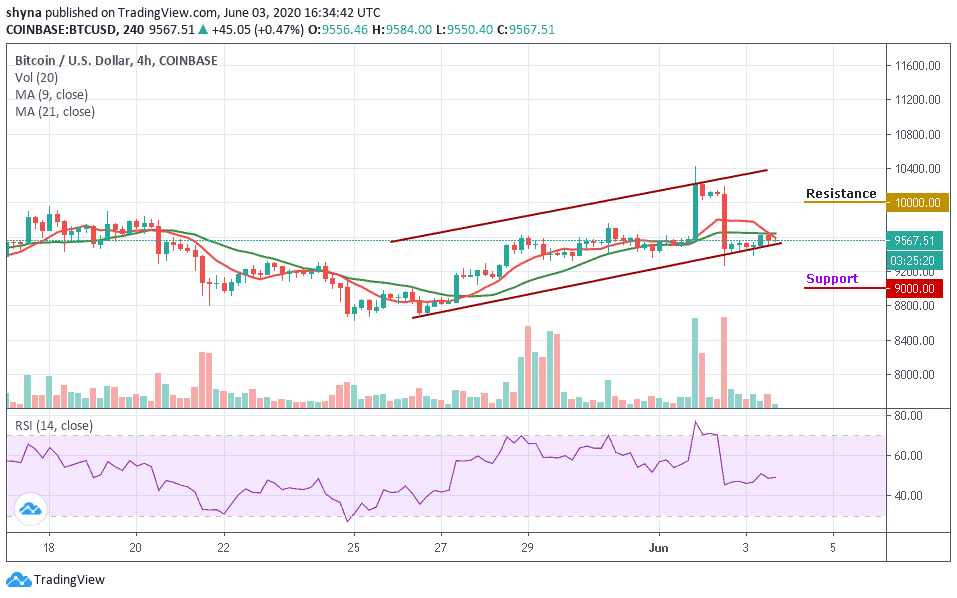
Moreover, if the bulls push the coin above the 9-day and 21-day moving averages, the price of Bitcoin may likely reach the potential resistance levels of $10,000, $10,200, and $10,400. Presently, the market is indecisive as the RSI (14) indicator moves below the 50-level.
Please note: Insidebitcoins.com is not a financial advisor. Do your research before investing your funds in any financial asset or presented product or event. We are not responsible for your investing results.
Join Our Telegram channel to stay up to date on breaking news coverage