Join Our Telegram channel to stay up to date on breaking news coverage
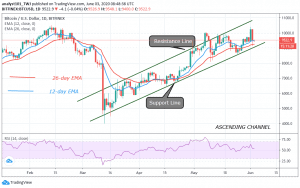
Bitcoin (BTC) Price Prediction – June 3, 2020
Following the breakdown on June 2, BTC/USD pair has continued to consolidate above $9,480 support. A breakdown below the current support will signal the resumption of the downtrend. Similarly, a breakout above the support will indicate the commencement of an upside range.
Key Levels:
Resistance Levels: $10,000, $11, 000, $12,000
Support Levels: $7,000, $6,000, $5,000
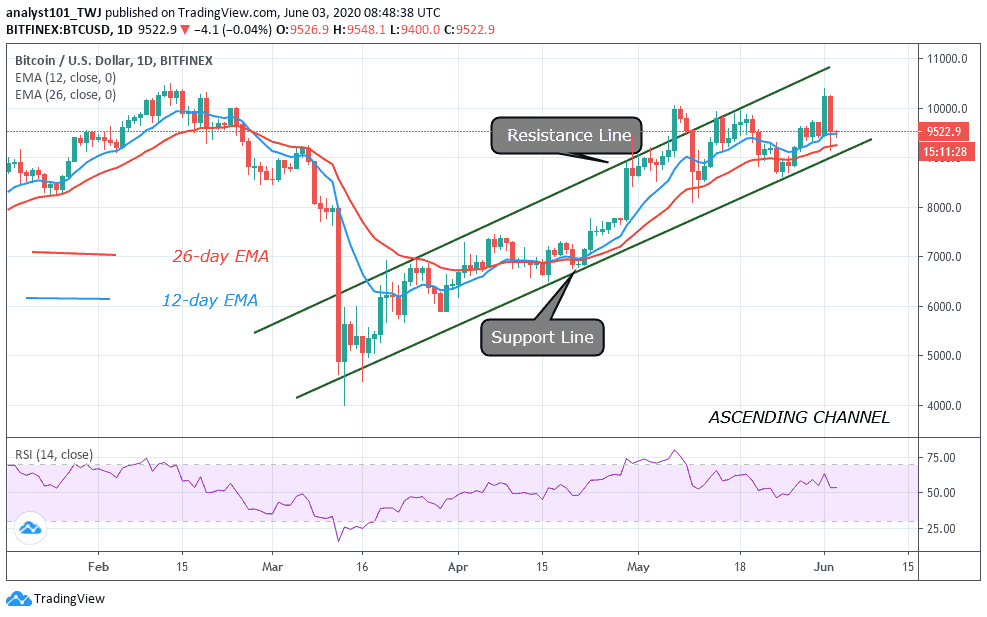
After the breakdown, Bitcoin has been trading above $9,500, and at other times the market will reach a low of $9,300. Bitcoin will face major downside if the bears break below $9,300 support. The king coin stands the chance of an upward move if the market holds above $9,300. In May, the bulls made several retests at the $10,000 overhead resistance because there was the consistency of price movement in the upside range. In the upside range, the market fluctuates between $9,300 and $9,800 as buyers engage the resistance zone. Nevertheless, after consolidation above $9,480 in the days to come, we shall know the direction of Bitcoin price.
On the upside, the advantage is on the side of the bulls as the market continues to consolidate in the bullish trend zone. A strong bounce will break through the $10,000 overhead resistance. A similar price action happened on June 1. However, the consolidation above the current support will be decided in a couple of days to come. On the downside, a breakdown from the current support will sink Bitcoin to the low of $8,750. The Relative Strength Index period 14 has fallen to level 53 indicating that price is the uptrend zone.
BTC/USD Medium-term Trend: Bullish (4-Hour Chart)
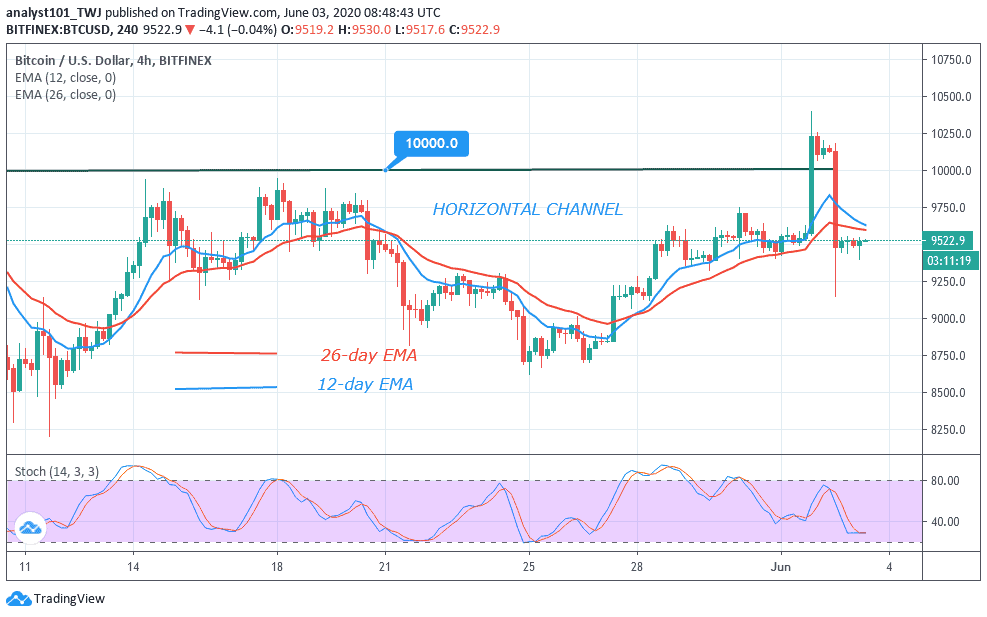
On the 4 hour chart, the market is consolidating after the breakdown above $9,400 support. The consolidation is characterized by small body candlesticks like Doji and the Spinning tops. These candlesticks indicate that buyers and sellers are undecided about the direction of the market. The market has fallen below a 40% range of the daily stochastic. However, the stochastic bands are making a U-turn indicating an upward move.
Please note: Insidebitcoins.com is not a financial advisor. Do your research before investing your funds in any financial asset or presented product or event. We are not responsible for your investing results.
Join Our Telegram channel to stay up to date on breaking news coverage