Join Our Telegram channel to stay up to date on breaking news coverage
Ripple Price Prediction – July 19
Ripple’s price is facing south as further downside may likely reach the critical support level at $0.50.
XRP/USD Market
Key Levels:
Resistance levels: $0.75, $0.80, $0.85
Support levels: $0.45, $0.40, $0.35
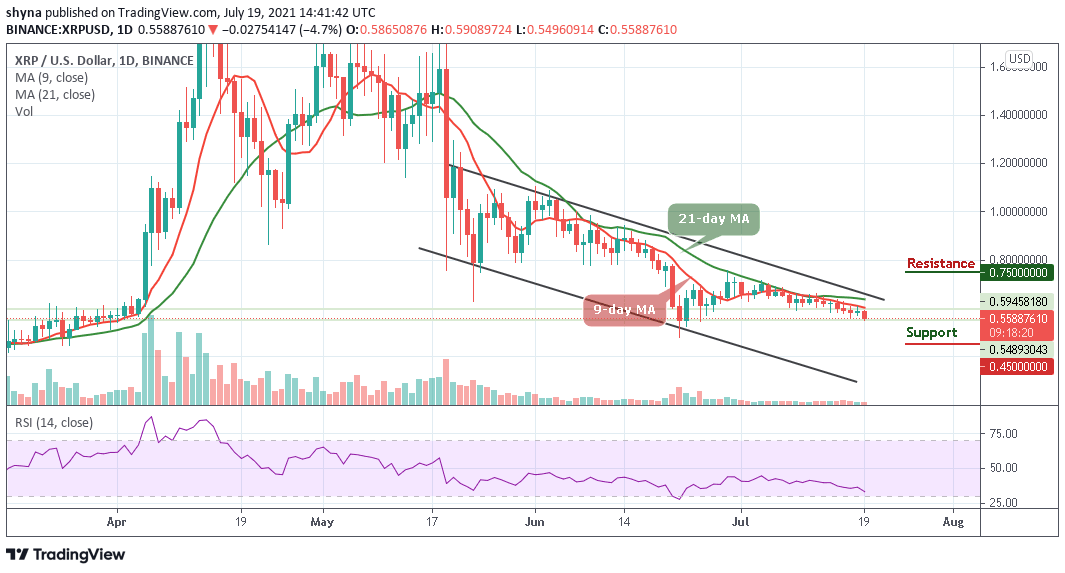
XRP/USD is seen sliding below the 9-day and 21-day moving averages as the coin prepares to revisit the $0.50 support before it could starts rising again. After struggling to reach $0.60, Ripple’s price has begun a slow and steady decline towards the south. As the coin faces the bearish movement, it may target the key support at $0.55 as the price moves into a short-term bearish zone.
Ripple Price Prediction: Ripple Price May Drop More
At press time, the Ripple price is currently exchanging hands at $0.56. Any attempt to stay below the 9-day and 21-day moving averages may likely open additional doors for more downsides—forcing the price towards the lower boundary of the channel. However, traders may experience a quick buy if the trade reaches the support at $0.50. Traders should also keep their eyes on the resistance levels of $0.75, $0.80, and $0.85.
Moreover, if the price fails to rebound, a bearish breakout is likely to trigger more selling opportunities for traders, which might cause the price to retest $0.45 and could further drop to $0.40, and $0.35 support levels respectively. The technical indicator Relative Strength Index (14) is likely to cross into the oversold region and if the signal line moves downward, the coin may fall more.
Against Bitcoin, the Ripple price is seen moving in sideways as the coin stays below the 9-day and 21-day moving averages. Therefore, if a rebound occurs, the coin may face an upward trend and the bullish continuation may take it to the resistance levels of 2200 SAT and 2400 SAT respectively.
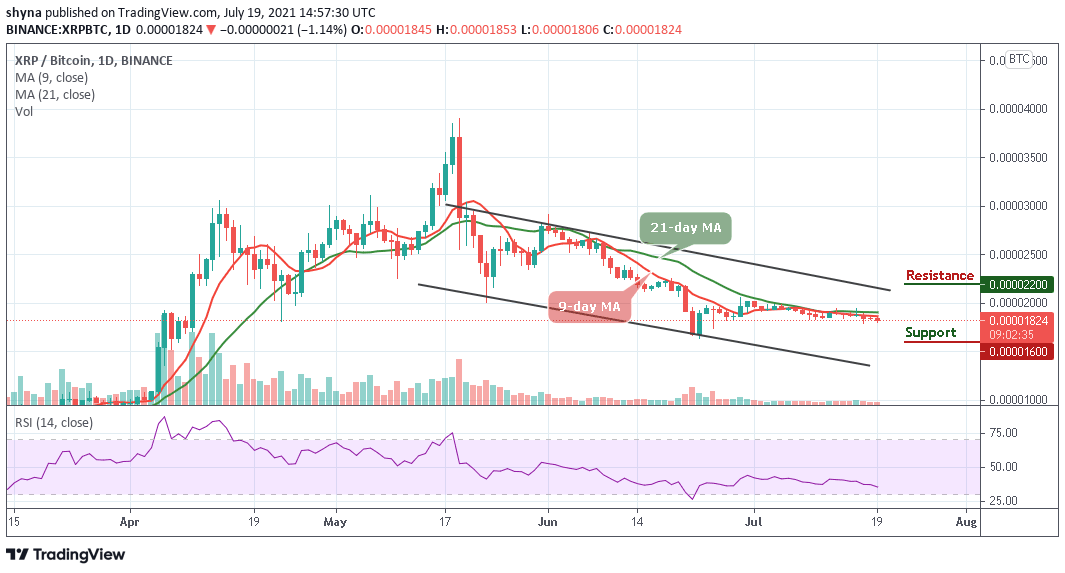
Looking at the daily chart, if the bulls fail to hold the selling pressure, the pair may likely fall below the channel and the nearest support levels lie at 1600 SAT and 1400 SAT. However, the technical indicator Relative Strength Index (14) is seen moving below 38-level, which indicates a downward movement.
Looking to buy or trade Ripple (XRP) now? Invest at eToro!
75% of retail investor accounts lose money when trading CFDs with this provider
Join Our Telegram channel to stay up to date on breaking news coverage