Join Our Telegram channel to stay up to date on breaking news coverage
Litecoin Price Prediction – July 17
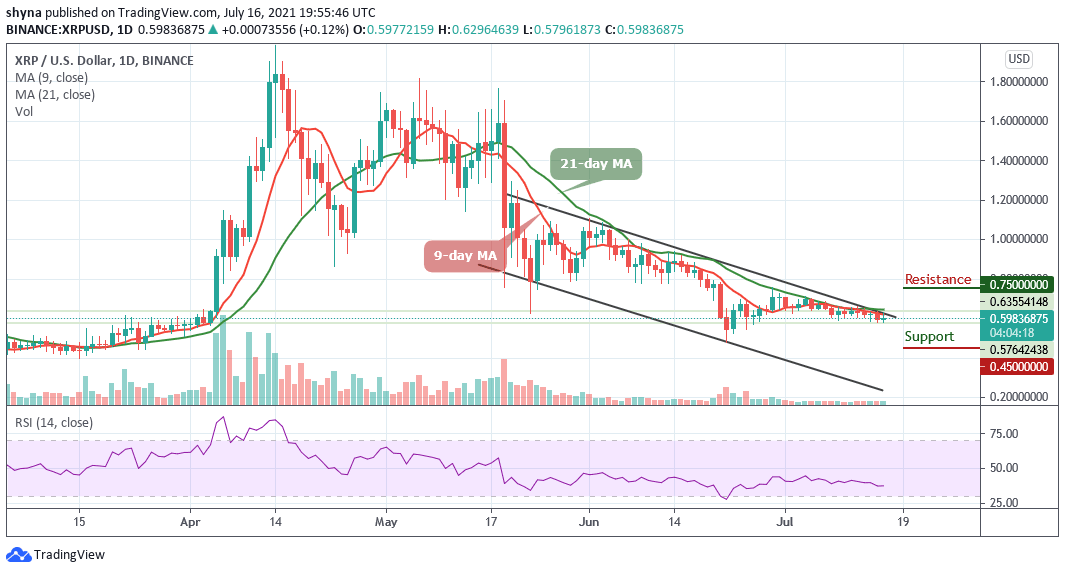
The Litecoin price keeps following a bearish movement within the channel as the coin aims to drop below $120.
LTC/USD Market
Key Levels:
Resistance levels: $150, $160, $170
Support levels: $95, $85, $75
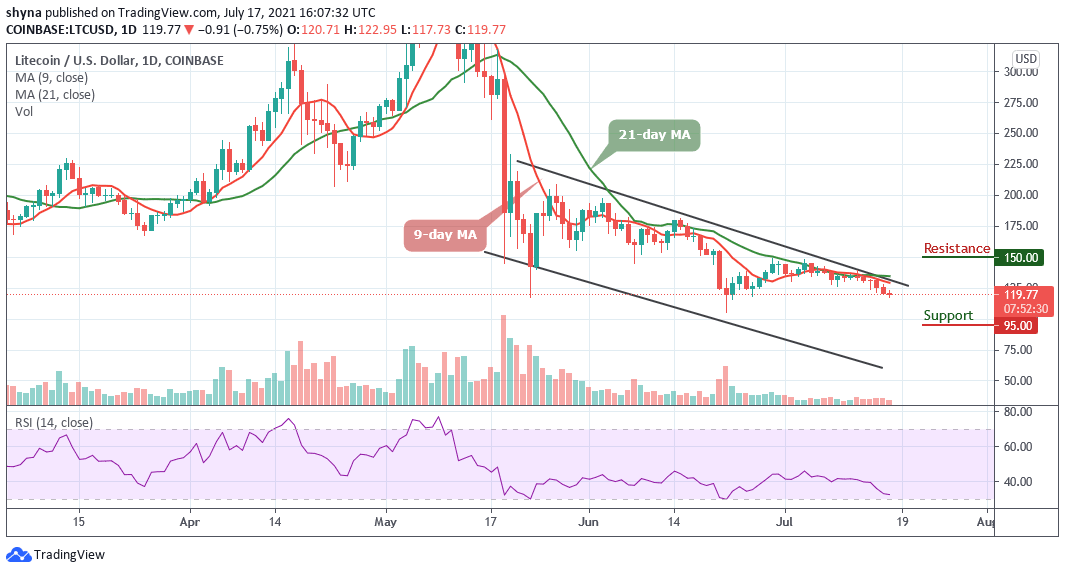
LTC/USD drops by over 0.24% over the past 24 hours of trading as the coin stays below the 9-day and 21-day moving averages to reach the daily low of $117.73 level. However, it seems that the bullish momentum is fading quickly as the technical indicator Relative Strength Index (14) plummets below 35-level. A break into the oversold zone may cause LTC/USD to remain at the downside as the bears take control of the market momentum.
Litecoin Price Prediction: Litecoin Price May Stay Below $120 Support
As the coin moves within the channel, in as much as the Litecoin price fails to rally from current trading levels, the greater the chance traders may see the cryptocurrency falling to another trading low. Meanwhile, a break towards the lower boundary of the channel may provoke another decline towards the support levels of $95, $85, and $75.
On the contrary, a break above the 9-day and 21-day moving averages may propel the Litecoin price to cross above the upper boundary of the channel which could push the coin to hit the potential resistance levels of $150, $160, and $170. Meanwhile, the Resistance Strength Index (14) is currently moving around 33-level, dropping below this level may cause the market to experience more downward trends.
Against Bitcoin, the Litecoin price is following a bearish movement below the 9-day and 21-day moving averages. The cryptocurrency on the market cap is finding its way toward the downside because the market movement has remained clouded by more red candles.
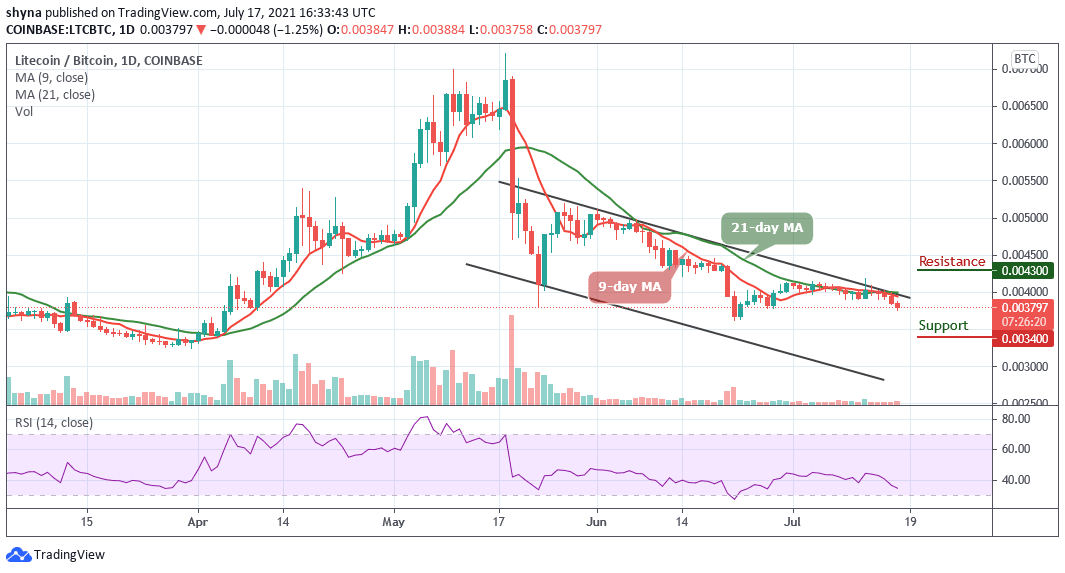
However, the Relative Strength Index (14) nosedives below 40-level, a bearish continuation may likely roll the market to the support of 3600 SAT with a possible break towards the lower boundary of the channel. Therefore, a further decline could be at the support level of 3400 SAT and below, which may establish a new low for the market. Meanwhile, any bullish movement above the upper boundary of the channel could hit the resistance level of 4300 SAT and above.
Looking to buy or trade Litecoin (LTC) now? Invest at eToro!
75% of retail investor accounts lose money when trading CFDs with this provider
Join Our Telegram channel to stay up to date on breaking news coverage