Join Our Telegram channel to stay up to date on breaking news coverage
Litecoin Price Prediction – July 15
The Litecoin price prediction faces a sharp price decline of around 4.67% at the time that the market opens and it currently trades at $124.90.
LTC/USD Market
Key Levels:
Resistance levels: $155, $165, $175
Support levels: $100, $90, $80
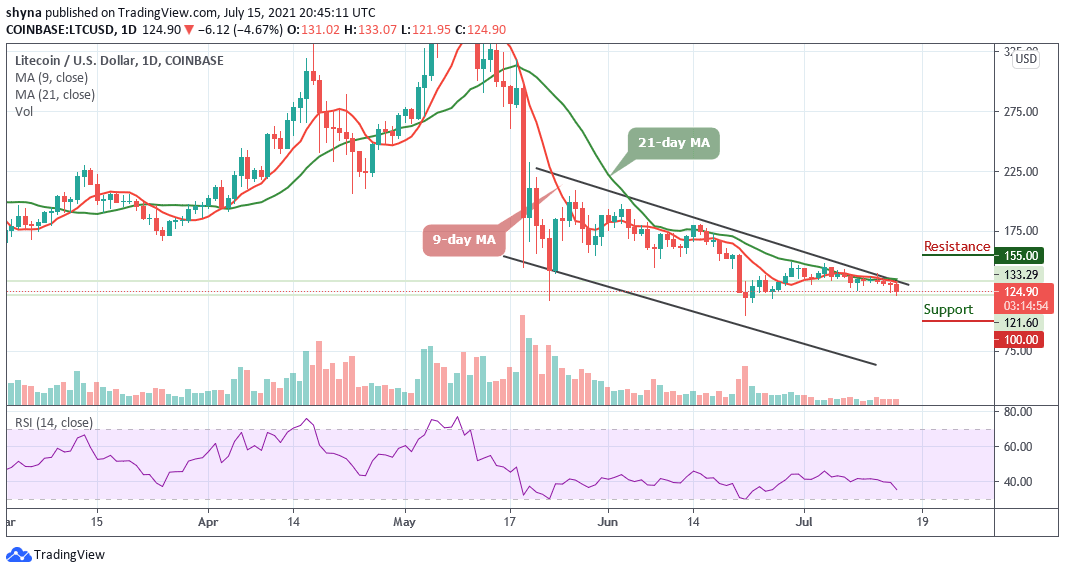
LTC/USD is trading in red as the coin slides below the 9-day and 21-day moving averages. After touching the daily high of $133 today, the Litecoin price couldn’t break $135 before it’s been rejected. However, LTC/USD may need to climb above the upper boundary of the channel convincingly and a clear break about this barrier could take the coin up to the $140 level.
Litecoin Price Prediction: The Litecoin Price Sets Lower High
According to the daily chart, the Litecoin price touches the daily low of $121.95, therefore, if the nearest support of $120 gives way, the sell-off may come to play and it may be extended towards the support level of $110. Meanwhile, sellers may be more dominant if the bears begin to post firm commitment as the technical indicator Relative Strength Index (14) shows a downward trend, indicating the latest selling pressure on the market.
Furthermore, traders could see a sharp drop below the 110 support. Breaking this barrier could further weaken the market to supports at $100, $90, and $80. However, a possible swing towards the upside is likely to retest the previous resistance levels above the upper boundary of the channel. Meanwhile, if the buyers manage to fuel the market more, traders may expect a further increase to $155, $165, and $175 resistance levels.
When compares with BTC, the Litecoin price continues to follow the downtrend. Now, the coin is trading below the 9-day and 21-day moving averages. We can expect close support at the 3500 SAT before breaking to 3000 SAT and critically 2800 SAT as the technical indicator Relative Strength Index (14) is likely to cross below 40-level.
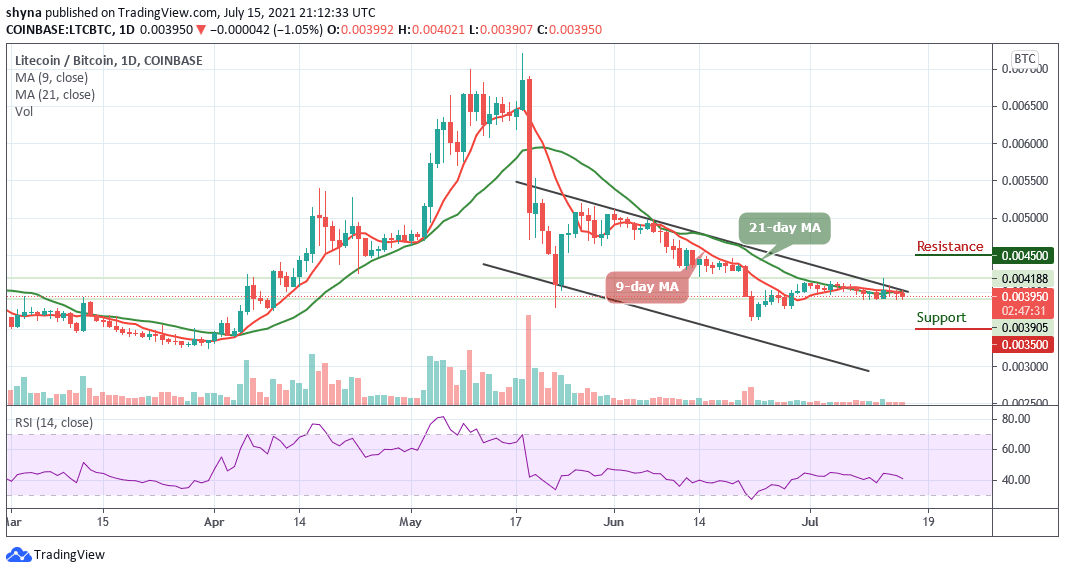
More so, there’s no sign of a bullish move for the Litecoin market at the moment but if a bullish move occurs and validates a break above the upper boundary of the channel, the coin may hit the nearest resistance at 4300 SAT. Immediately after this, traders may confirm a bull-run as the closest resistance lies at 4500 SAT and 4700 SAT.
Looking to buy or trade Litecoin (LTC) now? Invest at eToro!
75% of retail investor accounts lose money when trading CFDs with this provider
Join Our Telegram channel to stay up to date on breaking news coverage