Join Our Telegram channel to stay up to date on breaking news coverage
Litecoin Price Prediction – July 12
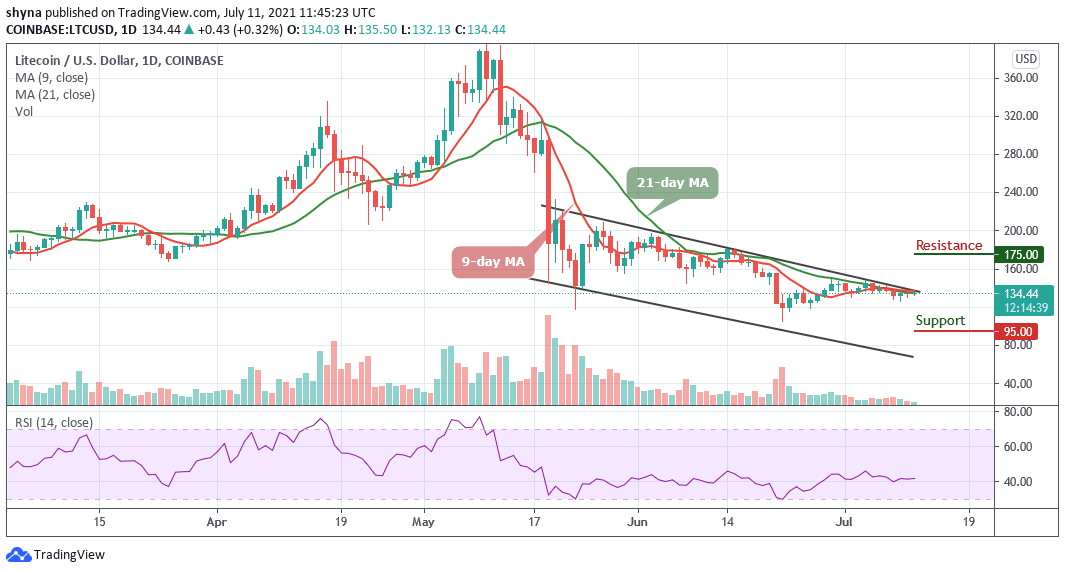
The Litecoin price moves sideways as the bulls still maintain the desire to defend the support at $135.
LTC/USD Market
Key Levels:
Resistance levels: $175, $185, $195
Support levels: $95, $85, $75
The intraday movement has not been that impressive but if LTC/USD bulls could improve more in the last hours of the day, the intraday traders can expect a more positive close. Presently, the main cryptocurrencies are slightly under market pressure as traders hope for improvement, but it may take some time.
Litecoin Price Prediction: LTC Price May Spike Higher
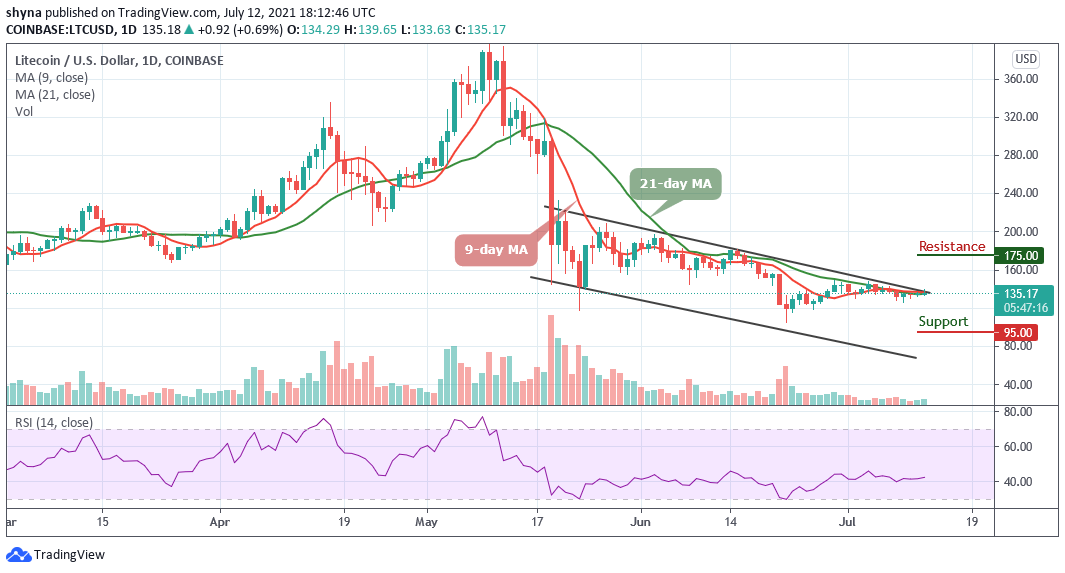
According to the daily chart, the Litecoin price is currently displaying a sign of subduing volatility with the price ready to cross above the channel. However, we can see that the trading volume is coming up slowly. Moreover, the intraday movement of the coin is quite unstable as the 9-day moving average sticks to the 21-day moving average.
However, trading at $135, more rebounds might occur and if the bulls put more effort one more time, they could push the Litecoin price above the upper boundary of the channel. The potential resistance levels are located at $175, $185, and $195 while the supports lie at $95, $85, and $75 respectively. More so, the technical indicator Relative Strength Index (14) is seen moving in the same direction above 40-level, suggesting a sideways movement.
Against Bitcoin, the Litecoin price is moving up slowly above the 9-day and 21-day moving averages. For now, bears continue to dance to the tune of bulls and currently trading at the 4063 SAT level. However, if the price crosses above the upper boundary of the channel, it could hit the nearest resistance at 3100 SAT, but further resistance could be found at 4500 SAT and 4700 SAT in a subsequent move.
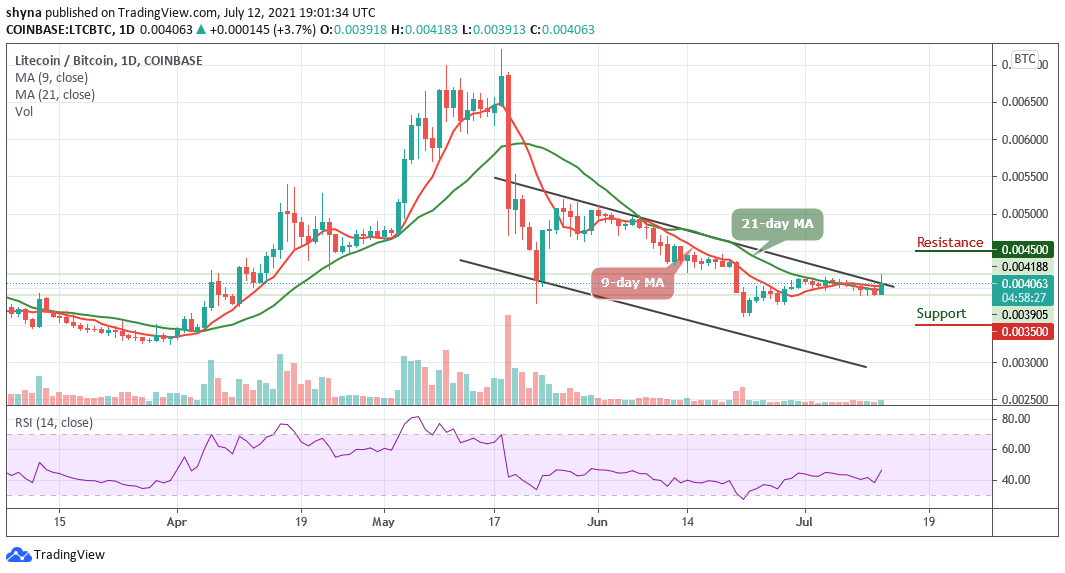
Similarly, a downward movement below the 9-day and 21-day moving averages may likely find immediate support at 3800 SAT, If the coin slide below this level, critical support lies at 3500 SAT and below. Meanwhile, the technical indicator Relative Strength Index (14) is convincingly facing the north and as it stands now, the bulls may begin to gain control of the market.
Looking to buy or trade Litecoin (LTC) now? Invest at eToro!
75% of retail investor accounts lose money when trading CFDs with this provider
Join Our Telegram channel to stay up to date on breaking news coverage