Join Our Telegram channel to stay up to date on breaking news coverage
XRP Price Prediction – July 31
In the last 24 hours, Ripple (XRP) is gaining more than 4.5% and the next resistance level may be at $0.28.
XRP/USD Market
Key Levels:
Resistance levels: $0.28, $0.30, $0.32
Support levels: $0.23, $0.21, $0.19
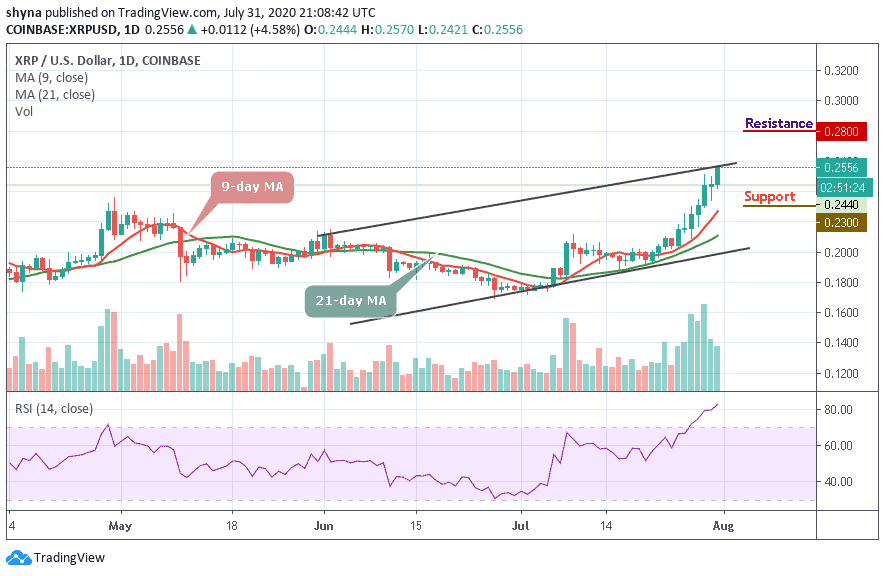
Today, XRP/USD jumps from $0.242 to the area above $0.250 in a matter of hours and touched an intraday high at $0.255. While the coin is seen retreating below this level, the pair retains bullish momentum. XRP is currently trading at $0.255 in a daily uptrend which may most likely form a bull flag in the short-term. In the short term, XRP/USD has gained more than 4.5% in the last 24 hours and it is one of the best-performing coins out of the top 10.
Meanwhile, due to a strong upside movement of the coin, Ripple’s XRP faces the uptrend as it is currently trading above the 9-day and 21-day moving averages. Yesterday’s low at $0.234 may now serve as strong support for the coin. If it is broken, the sell-off may be extended to $0.230.
Currently, the bulls are still the controller of the market. If the price moves below moving averages of 9-day and 21-day, the price could be pushed to the support level of $0.23, $0.21, and $0.19 levels. Moreover, the RSI (14) is extremely with the overbought condition, which indicates that the bullish trend may come to play. If the bulls can put more effort to push the XRP/USD higher, further resistance could be found at $0.28, $0.30, and $0.32.
Against Bitcoin, Ripple (XRP) is demonstrating some positive signs across the market. The trend is ranging in the long-term and moves within the channel. It is currently changing hands at 2249 SAT above the 9-day and 21-day moving averages.
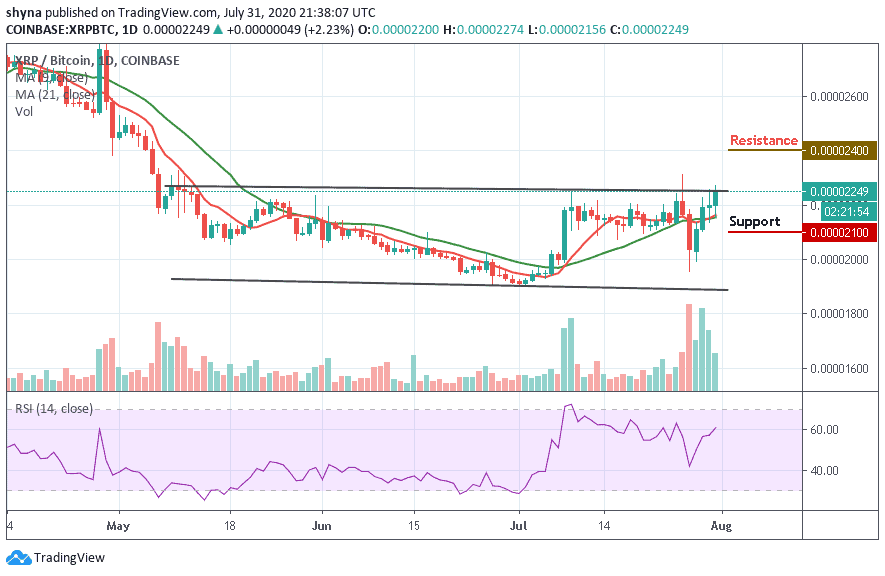
The resistance levels to look for are 2400 SAT and 2500 SAT while the closest support levels to keep an eye on are 2100 SAT, 2000 SAT, and potentially 2000 SAT. The technical indicator RSI (14) is palling to cross above the 60-level, indicating more bullish signals.
Join Our Telegram channel to stay up to date on breaking news coverage