Join Our Telegram channel to stay up to date on breaking news coverage
Bitcoin (BTC) Price Prediction – July 31
The daily chart reveals to us that the bullish momentum is notably strong but healthy consolidation is needed.
BTC/USD Long-term Trend: Bullish (Daily Chart)
Key levels:
Resistance Levels: $12,300, $12,500, $12,700
Support Levels: $10,300, $10,100, $9,900
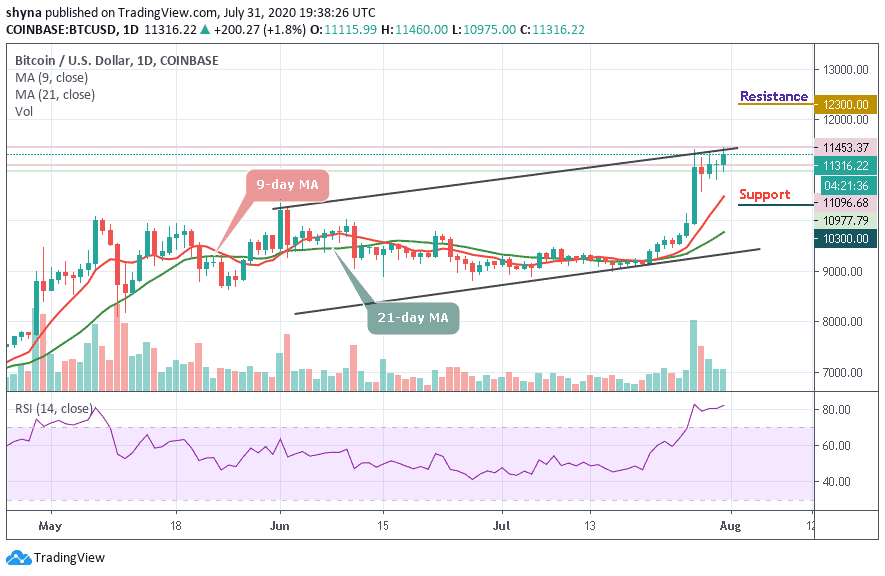
BTC/USD has been trading inside a daily uptrend for the past few days but has not consolidated just yet. Although this is not necessarily bad for the coin as the breakout above $10,000 was extremely important at that time. The next resistance level is all the way up at $12,000, a psychological level followed by $12,300 which happens to be a two-year high. However, the Bitcoin price is currently at $11,316 and the daily bull flag is on the verge of a breakout.
Moreover, traders may continue to see a small rejection since Bitcoin is already quite overextended. The daily RSI is still around 82 points and trading volume has been increasing. On the downside, the initial support is created by the psychological $10,800. It is reinforced by the 9-day moving average below this barrier A sustainable move below this barrier will bring $10,300, $10,100 and $9,900 that served as a strong resistance before the breakthrough.
Nevertheless, if the bulls show more strong commitment, BTC/USD could rise to another resistance level at $12,300, $12,500, and $12,700. With such a powerful display from the buyers, there’s potential that the move could spark a larger reversal in the bearish trend that was starting to take hold.
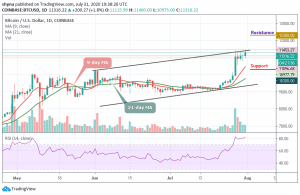
BTC/USD Medium-Term Trend: Ranging (1H Chart)
Looking at the 1-hour chart, Bitcoin’s price is currently trading around $11,413 and above the 9-day and 21-day moving averages after a reversal from aa daily low of $10,972 today. Meanwhile, we can see that the bullish supply is becoming heavy in the market while the bears are also trying to drag the price down.

In addition, if the buyers continue to strengthen and energize the market, they can further push the price to the $11,800 resistance level. Therefore, breaking the mentioned resistance could also allow the bulls to test the $11,600 and above. In other words, the RSI (14) is moving above 64-level, but coming below 60-level may drag the price to the support level of $11,200 and below.
Join Our Telegram channel to stay up to date on breaking news coverage