Join Our Telegram channel to stay up to date on breaking news coverage
XRP Price Prediction – April 29
In the last 24 hours, the price to Buy Ripple (XRP) has gained more than 6.50% and the next resistance level may be at $0.24.
XRP/USD Market
Key Levels:
Resistance levels: $0.25, $0.26, $0.27
Support levels: $0.18, $0.17, $0.16
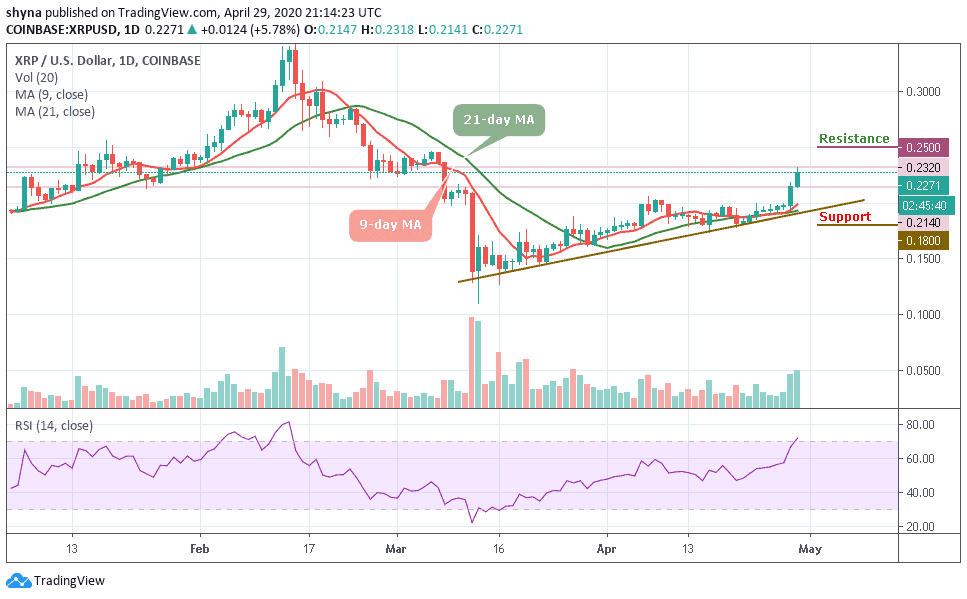
XRP/USD jumped from $0.214 to the area above $0.230 in a matter of hours and touched an intraday high at $0.232. While the coin has retreated to $0.228 at the time of writing, the pair retains bullish momentum. In the short term, XRP/USD has gained more than 6.52% in the last 24 hours. Currently, it is one of the best-performing coins out of the top 10.
Meanwhile, due to a strong upside movement of the coin, Ripple’s XRP broke free from the recent range and tested the highest level since April 8. The 9-day and 21-day moving averages at $0.190 now serve as strong support for the coin. If it is broken, the sell-off may be extended to $0.185.
Currently, the price of the coin is changing hands at $0.227 level and the bulls are still following the uptrend. If the price moves below the moving averages to cross the lower boundary of the channel, the coin may likely visit the support level of $0.18, $0.17 and $0.16.
Moreover, the RSI (14) moves into the overbought condition, which could give more bullish signals as further movement may take the market to the nearest resistance levels of $0.25, $0.26, and $0.27 respectively.
Against Bitcoin, XRP is still trading on the downside, although the price action has remained intact within the channel. If the selling pressure persists, the XRP price variation may likely create a new low in the few days. For now, the RSI (14) has nosedives below the 45-level; we may see a negative move in the market soon.
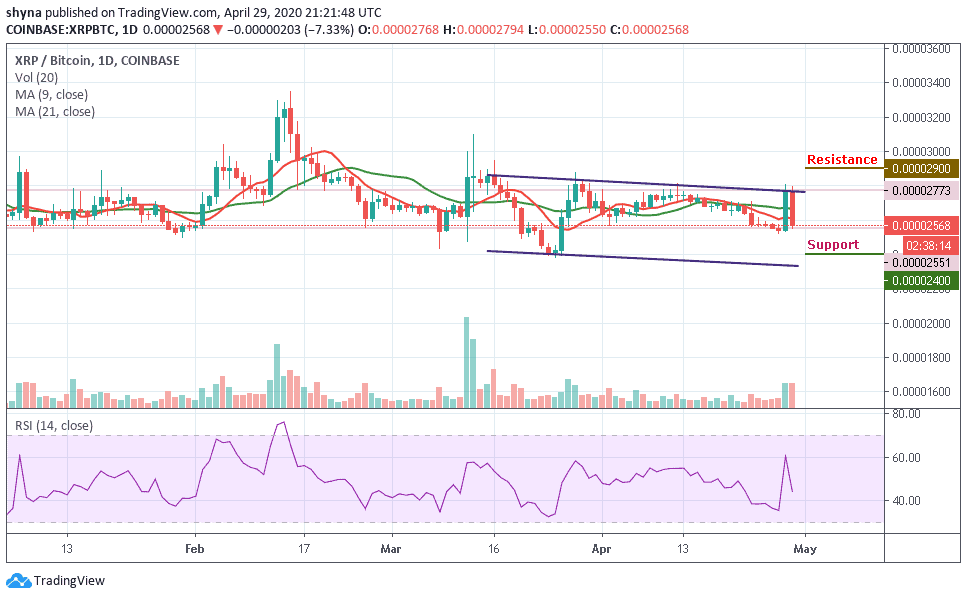
Moreover, the coin is also trading under the 9-day and 21-day moving averages at 2568 SAT. We can expect close support at the 2400 SAT before breaking to 2300 SAT and critically 2200 SAT levels. If a bullish move occurs and validates a break significantly above the moving averages, we can then confirm a bull-run for the market and the nearest resistance levels lie at 2900 SAT, 3000 SAT and 3100 SAT respectively.
Please note: Insidebitcoins.com is not a financial advisor. Do your research before investing your funds in any financial asset or presented product or event. We are not responsible for your investing results.
Join Our Telegram channel to stay up to date on breaking news coverage