Join Our Telegram channel to stay up to date on breaking news coverage
Bitcoin (BTC) Price Prediction – April 29
The price of Bitcoin has crossed the $8,000 threshold after gaining over 7.2% in the last 24 hours.
BTC/USD Long-term Trend: Bullish (Daily Chart)
Key levels:
Resistance Levels: $9,400, $9,600, $9,800
Support Levels: $7,000, $6,800, $6,600
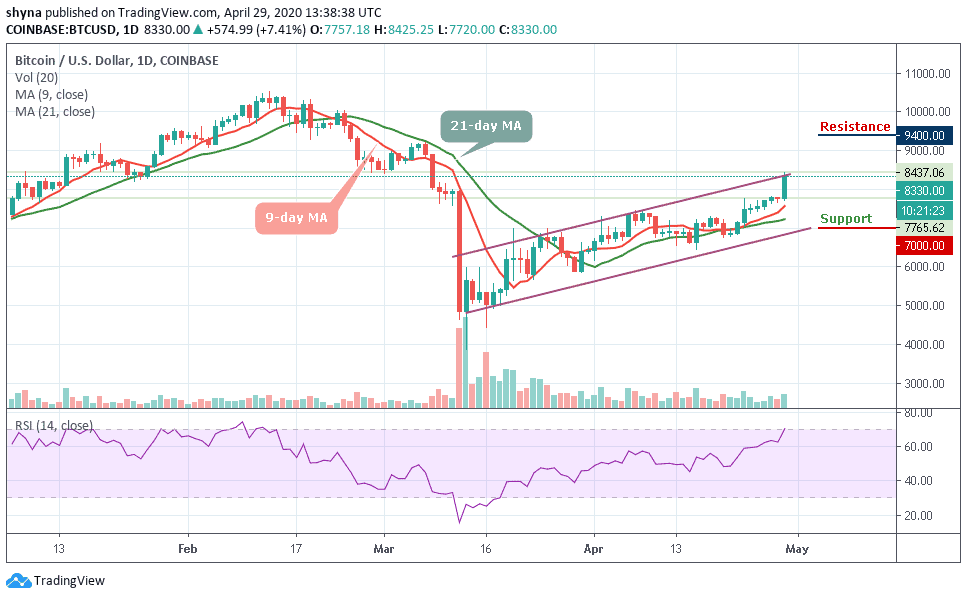
BTC/USD is back with a bang as it kick-starts today’s trading on a positive note. Before the coin could close yesterday, it has initiated a price recovery after it found a support level below $7,636. Bitcoin has rebounded noticeably and today, it has already formed a higher high while tracing a bullish trend. The Bitcoin price is pushing for recovery as it keeps following the upward trend.
However, the market is deciding around $8,330 far above the 9-day and 21-day moving averages, where the buyers are anticipating a clear breakout above the upper boundary of the channel. Meanwhile, the $9,200 and $9,300 levels may further surface as the key resistances should the $9,000 level play out. However, a strong bullish spike may take the price to $9,400, $9,600, and $9,800 levels.
Moreover, if the market makes a quick turn to the south, the BTC/USD price may likely drop below $8,000, and should this support fails to contain the sell-off, traders may see a further roll back to $7,000, $6,800 and critically $6,600. The RSI (14) suggests an upward movement for the coin as the signal line moves into the overbought conditions.
BTC/USD Medium – Term Trend: Bullish (4H Chart)
Bitcoin price surged upwards of over $500 in the past 24 hours, catapulting its price of $7,811 to reach where it currently trades at around $8,305 after touching $8,430 a few hours ago. However, the closest resistance levels lie at $8,800 and $9,000, while the nearest supports are $7,700 and $7,500 respectively.
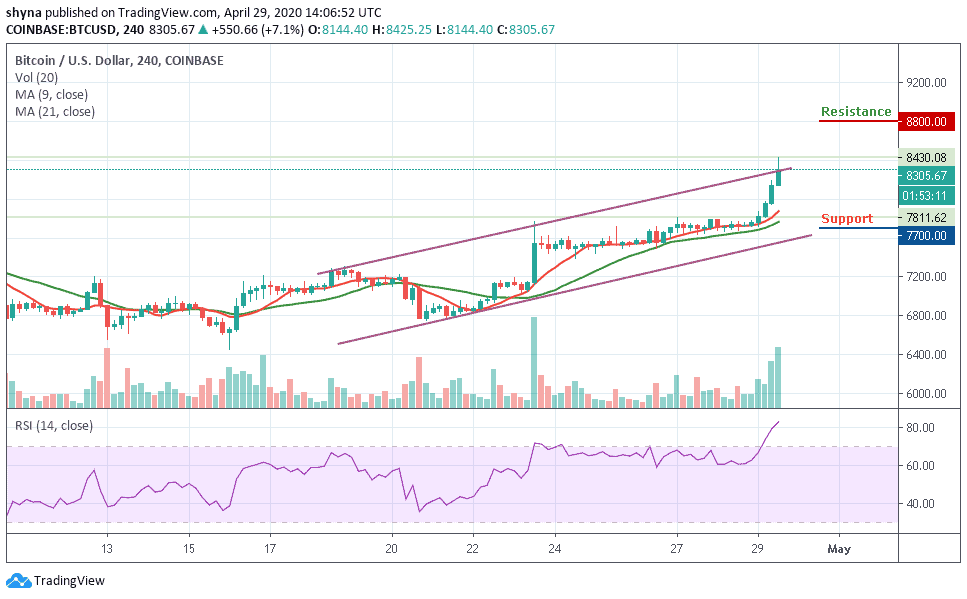
Moreover, as the coin moves above the 9-day and 21 -day moving averages, the technical indicator is strongly bullish and still flashing buy signals as the signal line of RSI (14) is extremely within the overbought territory. However, as of writing this, the indicator had encountered tough resistance levels within the overbought condition.
Please note: Insidebitcoins.com is not a financial advisor. Do your research before investing your funds in any financial asset or presented product or event. We are not responsible for your investing results.
Join Our Telegram channel to stay up to date on breaking news coverage