Join Our Telegram channel to stay up to date on breaking news coverage
BCH Price Prediction – April 28
The daily chart reveals that the Bitcoin Cash (BCH) retreats to test $235 support ahead of the breakout to $250.
BCH/USD Market
Key Levels:
Resistance levels: $280, $300, $320
Support levels: $200, $180, $160
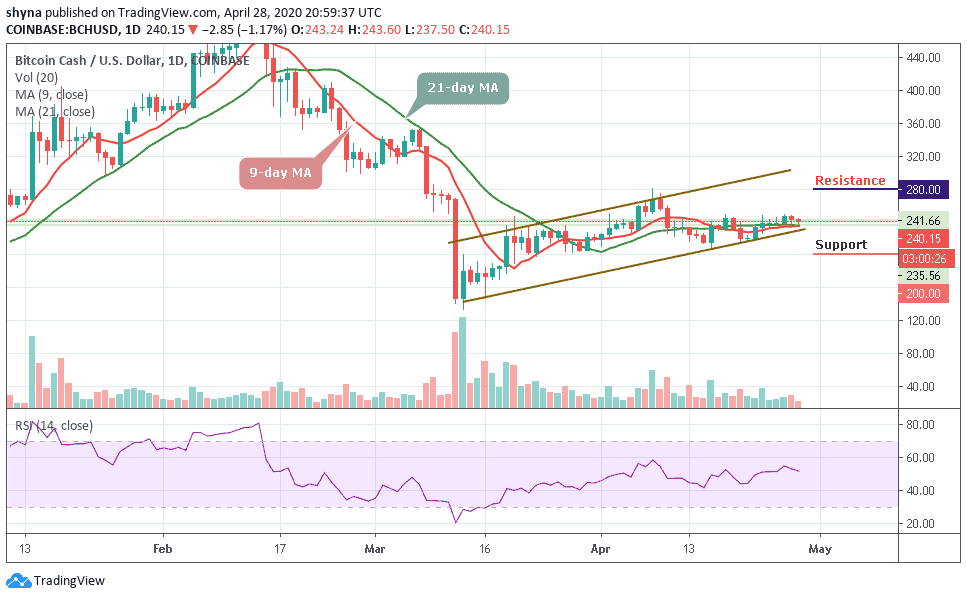
Despite maintaining a bullish movement for the past few days, it looks like BCH/USD is looking to slow down and settle around the $240 level. The market broke down today, touching its lowest daily level at $235.56. The current performance of the coin in the market is below the normal expectations of traders and the coin could soon recover from this downtrend.
Meanwhile, BCH/USD is currently trading at $240; the daily chart shows that the coin is trading above the 9-day and 21-day moving averages within the ascending channel. At the time of writing, the market price faces down and issuing a sell signal as the RSI (14) moves below the 53-level.
Moreover, a minimum swing may likely push the market to a $230 level of support. Exceeding this level could take the bears to $200, $180, and $160 levels by crossing the lower trend line of the channel. In other words, a high swing may likely take the bulls to a key resistance level of $260. Above this, the coin can possibly trigger a bullish rally which may take the price to $280, $300, and $320 resistance levels.
When compared with BTC, the daily chart reveals that the sellers are still showing more commitment to BCH trading. However, following the recent negative signs, the trend may continue to go down if the bears continue to put more pressure on the market.
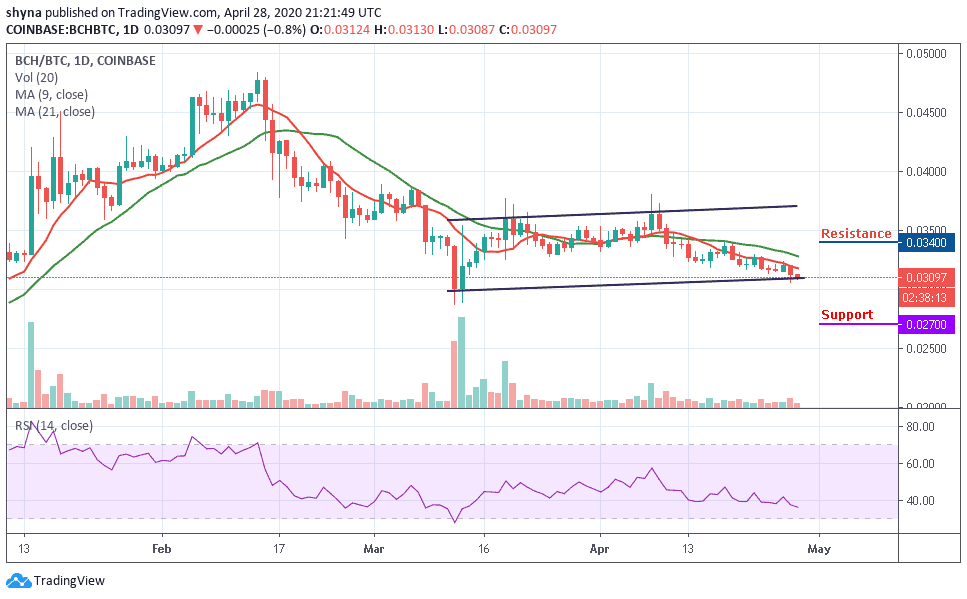
However, as the RSI (14) signal line moves below 37-level, if the buyers failed to hold the support of 0.0309 BTC, the market may focus on the downtrend. Similarly, pushing it below the channel may bring it to the nearest supports at 0.0270 BTC and 0.0260 BTC but a good and sound rebound could take the price above the moving averages to 0.0340 BTC and 0.0350 BTC resistance levels.
Please note: Insidebitcoins.com is not a financial advisor. Do your research before investing your funds in any financial asset or presented product or event. We are not responsible for your investing results.
Read more:
- Cardano Price May Break Down $0.41 Level, Buyers Prefer TAMA
- DOGE Price Prediction: Bullish Trend May continue After a Pullback
Join Our Telegram channel to stay up to date on breaking news coverage