Join Our Telegram channel to stay up to date on breaking news coverage
XRP Price Prediction – July 12
In the last 24 hours, Ripple (XRP) has gained more than 2.06% and the next resistance level may be at $0.220.
XRP/USD Market
Key Levels:
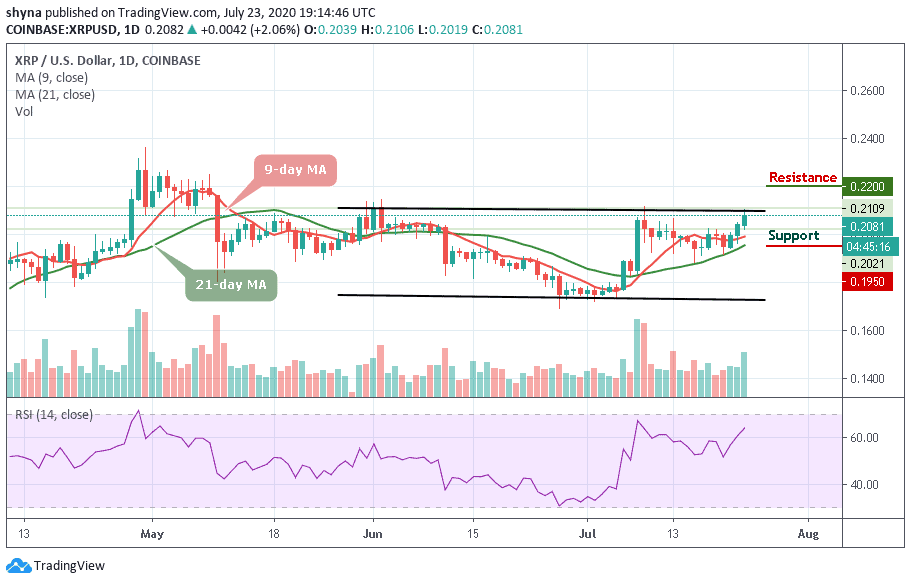
Resistance levels: $0.220, $0.225, $0.230
Support levels: $0.195, $0.190, $0.185
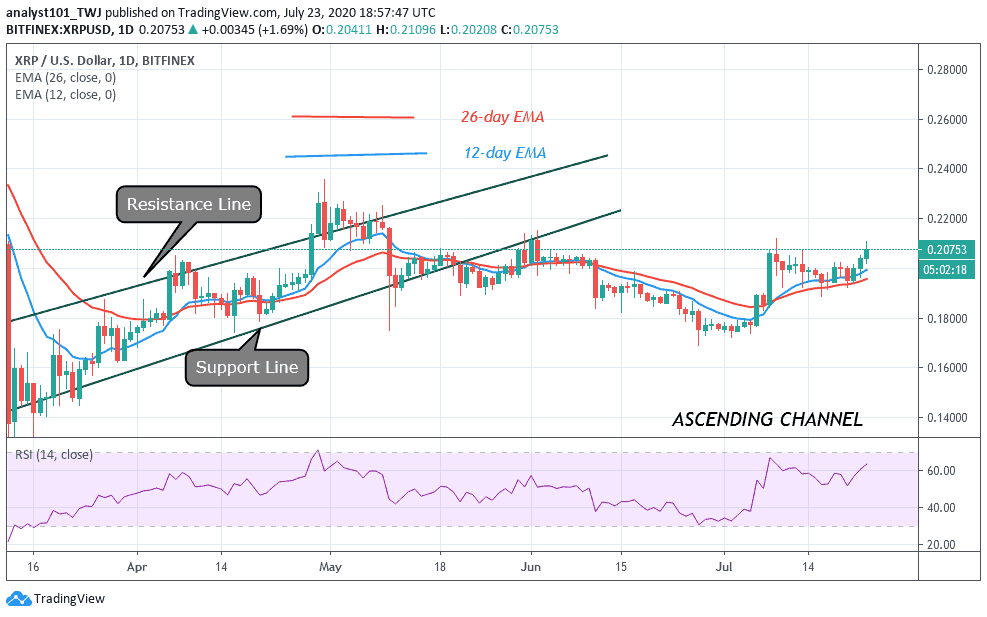
XRP/USD jumps from $0.202 to the area above $0.205 in a matter of hours and touches an intraday high at $0.210. While the coin has retreated to $0.208 at the time of writing, the pair retains bullish momentum. In the short term, XRP/USD has gained more than 2.06% in the last 24 hours.
Meanwhile, due to a strong upside movement of the coin, Ripple’s XRP broke free from the recent range and tested the highest level since July 16. The 9-day and 21-day moving averages now serve as strong support for the coin. If it is broken, the sell-off may be extended to $0.192.
Currently, the price of the coin is changing hands at $0.208 level and the bulls are still following the uptrend. If the price moves below moving averages, the coin may likely visit the support level of $0.195, $0.190, and $0.185. But the technical indicator RSI (14) is seen moving above 64-level, suggesting more bullish signals as further movement may take the market to the nearest resistance levels of $0.220, $0.225, and $0.230 respectively.
Against BTC, Ripple (XRP) is demonstrating some positive signs across the market. The trend is perpetually looking bullish in the long-term while crossing above the 9-day and 21-day moving averages. According to the daily chart, the coin is currently changing hands at the 2174 SAT, witnessing some sideways movement.
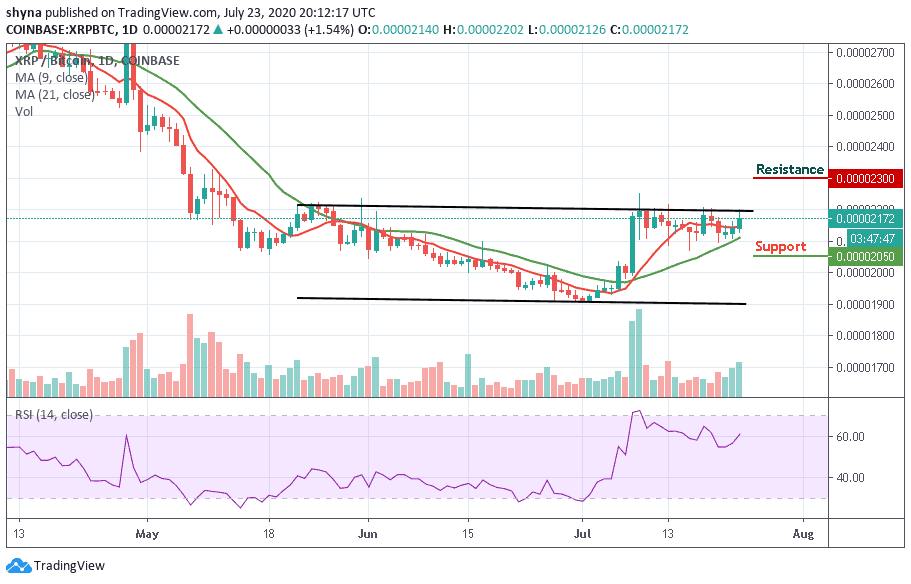
However, the resistance levels to look for are 2300 SAT, 2350 SAT and 2400 SAT while the closest support levels to keep an eye on are 2050 SAT, 2000 SAT, and critically 1950 SAT. The technical indicator RSI (14) is moving above the 60-level, indicating more bullish signals in the market soon.
Join Our Telegram channel to stay up to date on breaking news coverage