Join Our Telegram channel to stay up to date on breaking news coverage
XRP Price Analysis – July 24
Ripple has recovered from the downtrend after the last bearish impulse on July 16. The upward move has been consistent as bulls breached the resistance levels of $0.20 and $0.205. Similarly, the XRP/BTC is making an upward move as the coin rebounded above level Ƀ0.000020000.
XRP/USD Market
Key Levels:
Resistance Levels: $0.24, $0.26, $0.28
Support Levels: $0.22, $0.20, $0.18
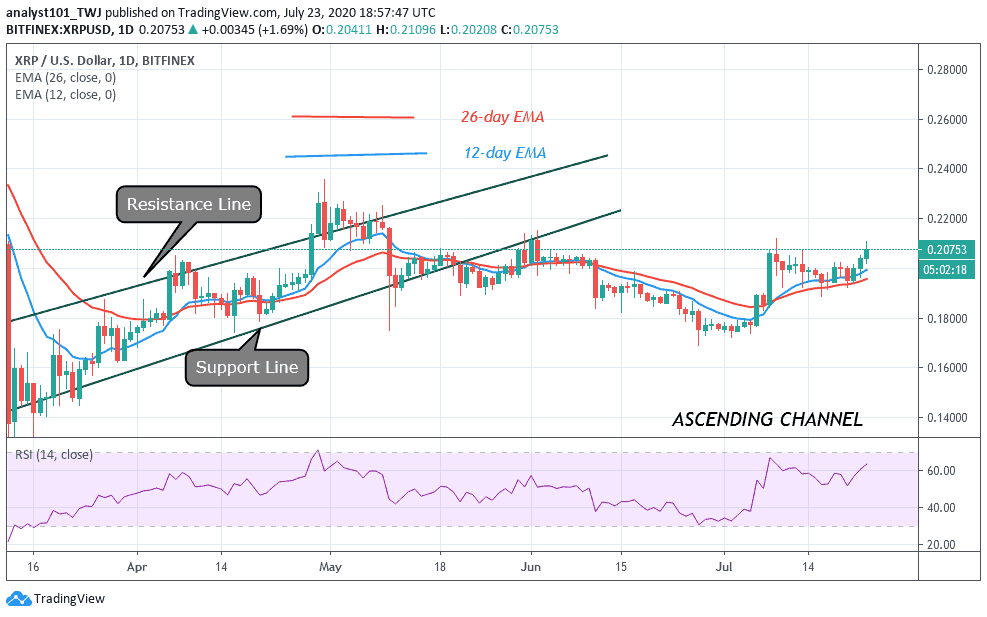
XRP/USD is now in an uptrend as the coin makes steady progress on the upside. Ripple’s downward move was initially to a low of $0.17. After making corrections above $0.175, XRP rebounded and rallied to $0.21 on July 9. The market reached the overbought region as sellers emerged to push prices down to $0.19 on July 16. At the low of $0.19, buyers resumed a fresh uptrend. The price corrected upward to $0.20 high on July 18. The bulls could not penetrate the $0.20 resistance.
Today, Ripple has made a strong bounce as price broke the $0.20 and $0.205 resistance. The coin is currently retesting the $0.21 resistance. In the first upward move, the bulls were resisted as the coin reached the overbought region. Today, in the second uptrend, XRP is facing resistance at the $0.21 resistance. On the upside, if the bull sustained price above $0.205 support, the uptrend will continue. In the meantime, XRP is retracing from the $0.21 resistance. If price retraces to $0.205 support, the uptrend will resume. Otherwise, the market will fall to $0.195 low.
Similarly, on the XRP/BTC chart, the downtrend reached the low of level Ƀ0.000019270. The price corrected upward and rebounded above level Ƀ0.000020000.
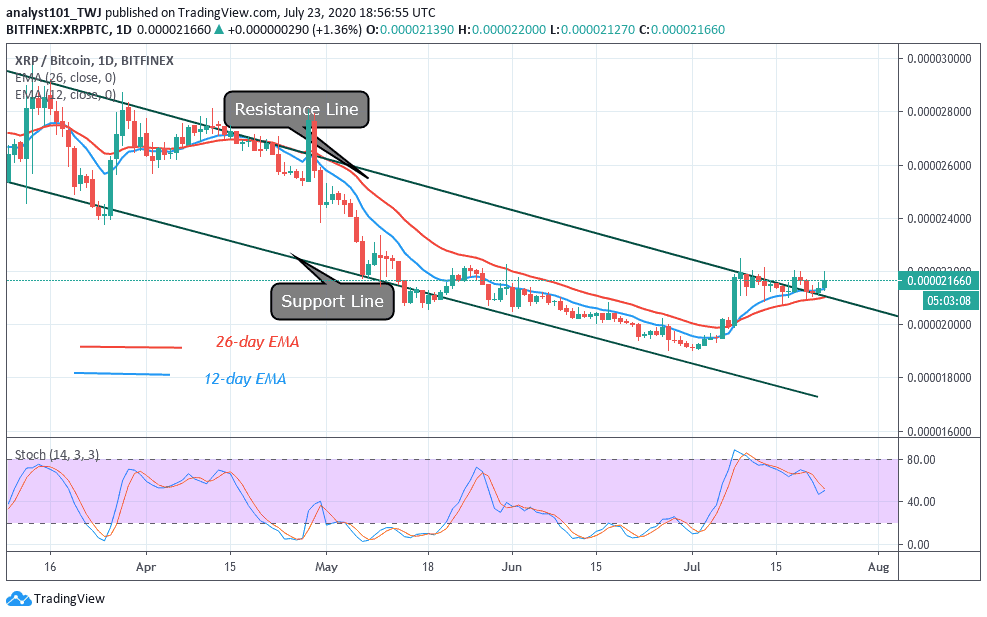
The price moved up to break the resistance line of the descending channel. Technically, when price breaks and closes above the trend line, it implies that the previous trend has been terminated. The coin has risen to level Ƀ0.000021690 at the time of writing. XRP/BTC is above 40% range of the daily stochastic. This explains that the market is in a bullish momentum.
Join Our Telegram channel to stay up to date on breaking news coverage