Join Our Telegram channel to stay up to date on breaking news coverage
XRP Price Analysis – June 13
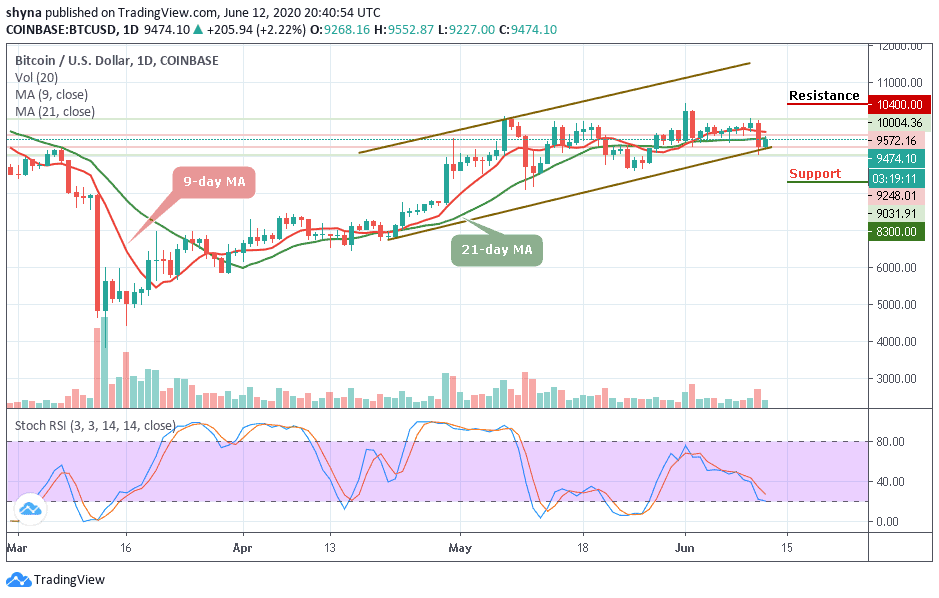
Ripple price is facing an increase in selling pressure below the $0.228 resistance against the US dollar. So is it time to buy Ripple?
XRP/USD Market
Key Levels:
Resistance levels: $0.210, $0.220, $0.230
Support levels: $0.170, $0.160, $0.150

Ripple price is slowly declining below key supports against USD. XRP/USD price might revisit the $0.180 support before it could start a fresh increase. After struggling to stay above $0.190, Ripple started a slow and steady decline. The coin is trading below the key $0.195 support level to move into a short term bearish zone.
In addition, XRP/USD is currently changing hands at $0.192 and any attempt to make it cross below the lower boundary of the channel may open the doors for more downsides and the price could spike below the $0.180 support level. However, for the uptrend, traders should keep an eye on this level before creating a new bullish trend at the resistance levels of $0.210, $0.220, and $0.230.
However, the market may experience a quick buy once the trade reaches the support at $0.180. And should the price fails to rebound, then a bearish breakout is likely to trigger more selling opportunity for traders, which might cause the price to reach $0.170 and could further drop to $0.160 and $0.150 support levels respectively. The RSI (14) nosedive to level 40. If the price moves downward, XRP may fall further.
When compared with Bitcoin, XRP is currently trading at 3029 SAT and it’s trading under the 21-day moving average. If the above-mentioned level could serve as market support, the price can be pushed up towards the resistance level of the 2100 SAT. By reaching this level, the price may likely visit 2200 SAT and 2300 SAT resistance levels.
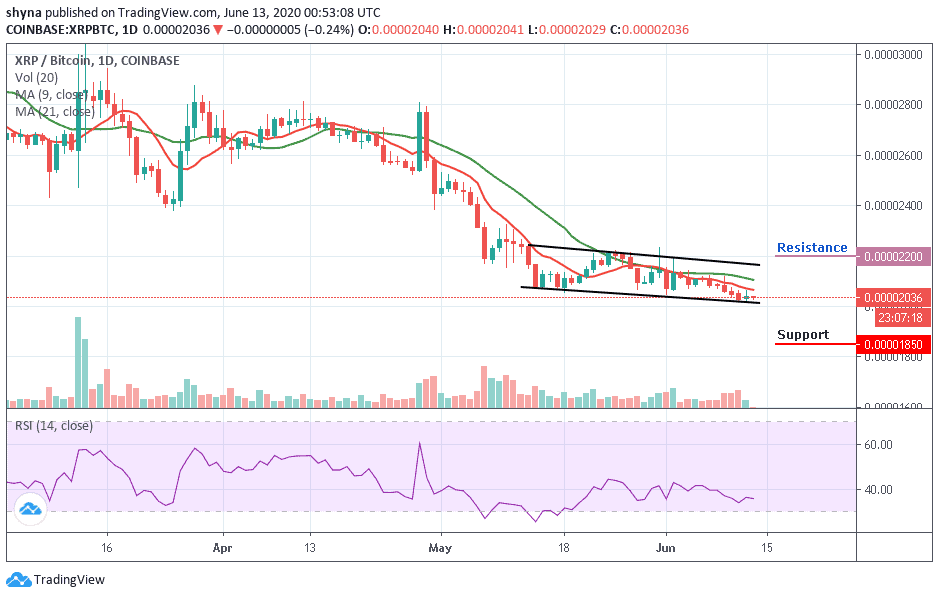
However, if the bulls fail to push the price to the nearest resistance, the market may begin a downtrend and the pair could probably record further declines at 2000 SAT. Breaking this level could push the market to the nearest support levels, at 1850 SAT and below. Meanwhile, the RSI (14) is moving around 35-level, which may possibly give some bearish signals in the nearest term.
Please note: Insidebitcoins.com is not a financial advisor. Do your research before investing your funds in any financial asset or presented product or event. We are not responsible for your investing results.
Join Our Telegram channel to stay up to date on breaking news coverage