Join Our Telegram channel to stay up to date on breaking news coverage
Bitcoin (BTC) Price Prediction – June 12
Bitcoin price is trading nicely above the $9,300 and the coin must climb above the $9,500 resistance to continue higher.
BTC/USD Long-term Trend: Ranging (Daily Chart)
Key levels:
Resistance Levels: $10,400, $10,600, $10,800
Support Levels: $8,300, $8,100, $7,900
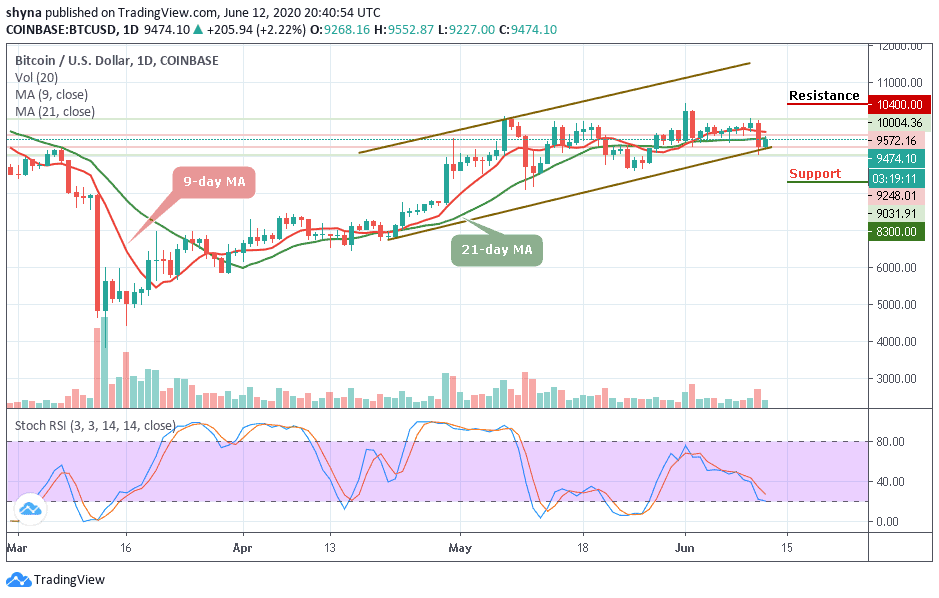
BTC/USD started improving, although many coins are following the footstep of Bitcoin as well. The Bitcoin price also reflected a similar movement as the coin improve in price movement at the moment. Within the first few hours of today’s trading, BTC/USD has moved up from $9,248 to $9,572 and now $9,474.
However, BTC/USD is struggling to climb higher above the $9,600 and $9,800 resistances as the pair may be settling in a tight range between $9,000 and $9,400 below the 9-day and 21-day moving averages. In addition, this weekend session is seeing Bitcoin and other major cryptos exchanging on a sour tone.
Moreover, if the market decides to go down, Bitcoin’s price may drop to $8,500, and should this support fails to contain sell-off, we may see a further drop to $8,300, $8,100 and potentially $7,900. More so, the resistance levels to watch are $10,400, $10,600, and $10,800 respectively. Meanwhile, the stochastic RSI faces the oversold zone, suggesting more bearish signals.
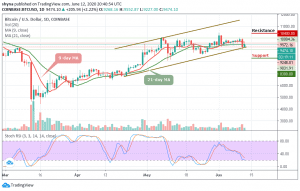
BTC/USD Medium-Term Trend: Ranging (4H Chart)
Looking at the chart, BTC/USD is clearly facing a lot of resistance near the $9,500 and $9,600 level. A successful close above the $9,500 level is a must for bullish acceleration. If not, there is a risk of a downside extension below the $9,200 support. If there is a downward move, initial support is near the $9,300 level and the main support is near the $9,200 level, below which there is a risk of another decline towards $9,000.

Furthermore, if there are more gains, the $9,500 level is likely to act as a major hurdle in the near term for Bitcoin. So if there is an upside break above the $9,600 resistance, the next stop for the bulls may perhaps be near the $9,700 and above as the RSI (14) moves above 40-level, which indicates that a bullish trend may come into play.
Please note: Insidebitcoins.com is not a financial advisor. Do your research before investing your funds in any financial asset or presented product or event. We are not responsible for your investing results.
Join Our Telegram channel to stay up to date on breaking news coverage