Join Our Telegram channel to stay up to date on breaking news coverage
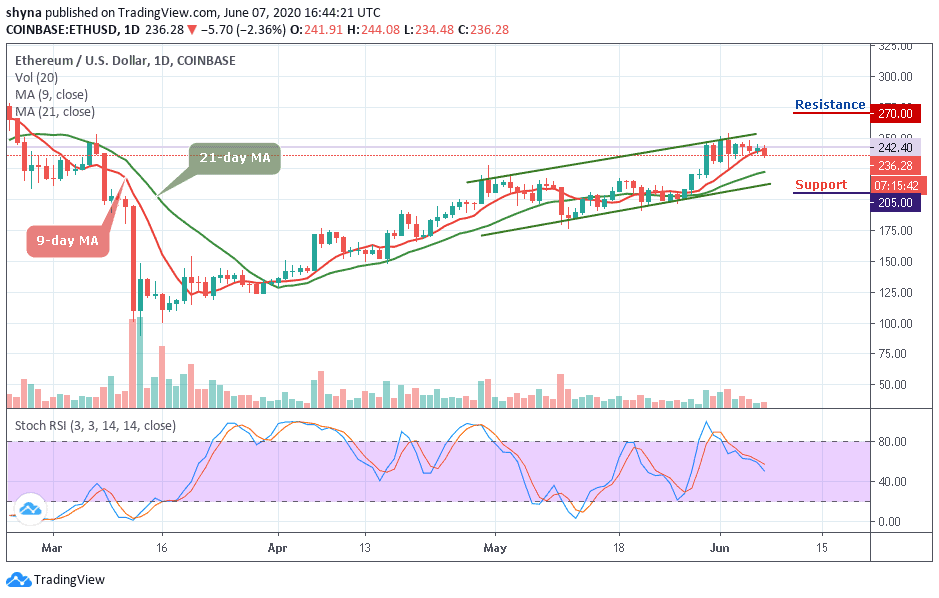
XRP Price Prediction – June 7
The Ripple (XRP) price fails to break out of a rising ascending channel as the price couldn’t gather enough momentum.
XRP/USD Market
Key Levels:
Resistance levels: $0.220, $0.230, $0.240
Support levels: $0.185, $0.175, $0.165
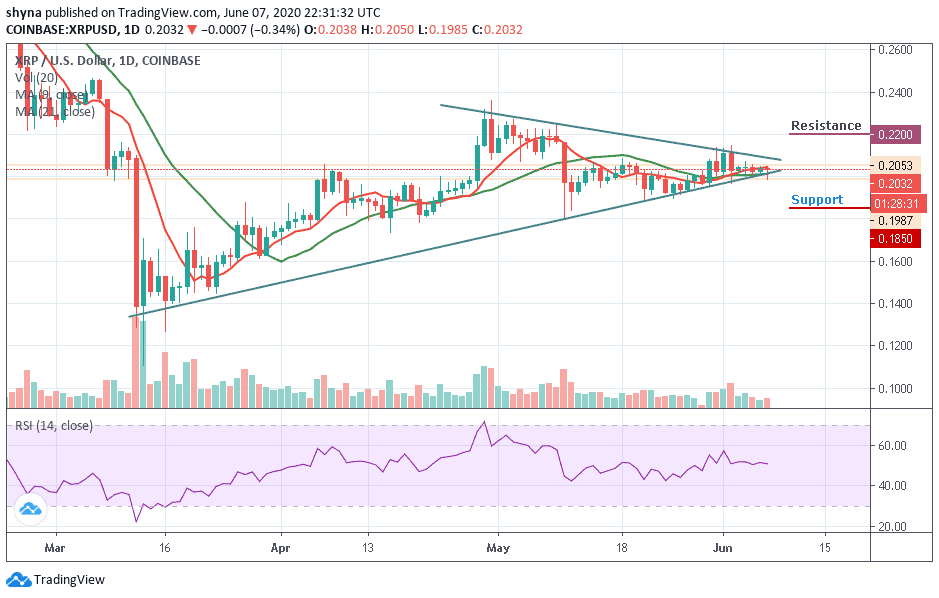
Today, if you buy Ripple with PayPal broke free from the recent range-bound, the price absorbed stops located below $0.205 and slipped to $0.198 in a matter of hours. While the price has partially recovered the losses to trade at $0.203 with 0.34% lower from the beginning of the day. Meanwhile, XRP/USD needs to regain ground above $0.210 to mitigate the bearish pressure.
However, XRP/USD is currently changing hands at $0.203 and any attempt to make it cross below the channel may open the doors for more downsides and the price could spike below the $0.190 support before creating a new bearish trend at the support levels of $0.185, $0.175 and $0.165.
For the upside, if you buy Ripple you will need to make a sustainable move above $0.210 as soon as possible to negate an immediate bearish scenario and improve the technical picture. Nevertheless, for the upside to gain traction, the coin needs to regain ground above $0.215, while $0.220 $0.230 and $0.240 resistance levels are the ultimate aims for the bulls.
More so, the technical indicator RSI (14) suggests that the market may likely continue moving sideways.
Against Bitcoin, the Ripple (XRP) is moving sideways within the descending channel. If the selling pressure persists, the XRP price variation may likely bring a new low. At the moment, the RSI (14) is making an attempt to cross below 40-level; if possible, a negative move may come to play in the market.
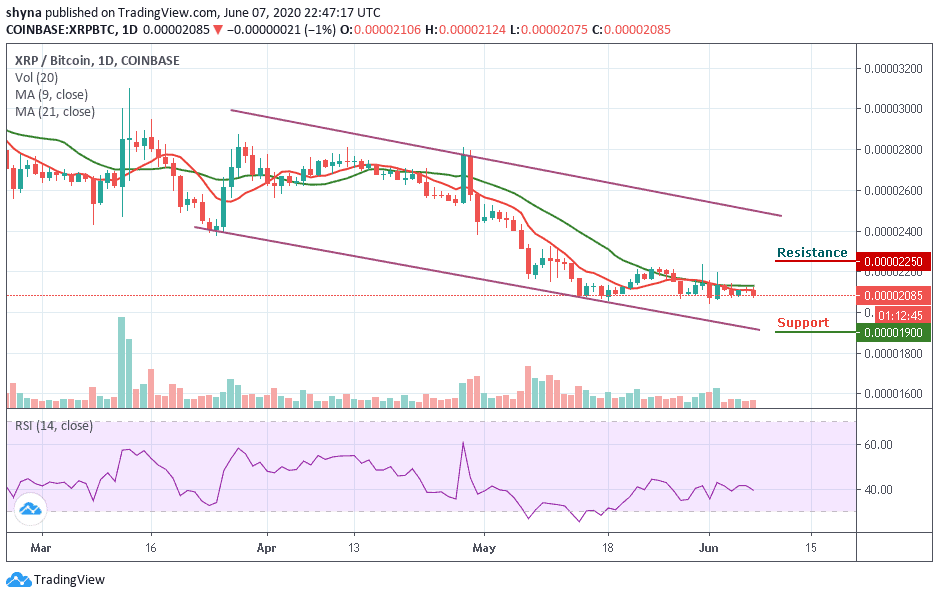
However, traders may expect close support below the 9-day and 21-day moving averages before breaking to 1900 SAT and critically 1800 SAT levels. If a bullish movement occurs and validates a break above the moving averages within the channel; we can then confirm a bull-run for the market and the nearest resistance levels lie at 2250 SAT and above.
Please note: Insidebitcoins.com is not a financial advisor. Do your research before investing your funds in any financial asset or presented product or event. We are not responsible for your investing results.
Join Our Telegram channel to stay up to date on breaking news coverage