Join Our Telegram channel to stay up to date on breaking news coverage
ETH Price Prediction – June 7
ETH/USD must break and close above the $245 price mark, for further upside.
ETH/USD Market
Key Levels:
Resistance levels: $270, $275, $280
Support levels: $205, $200, $195
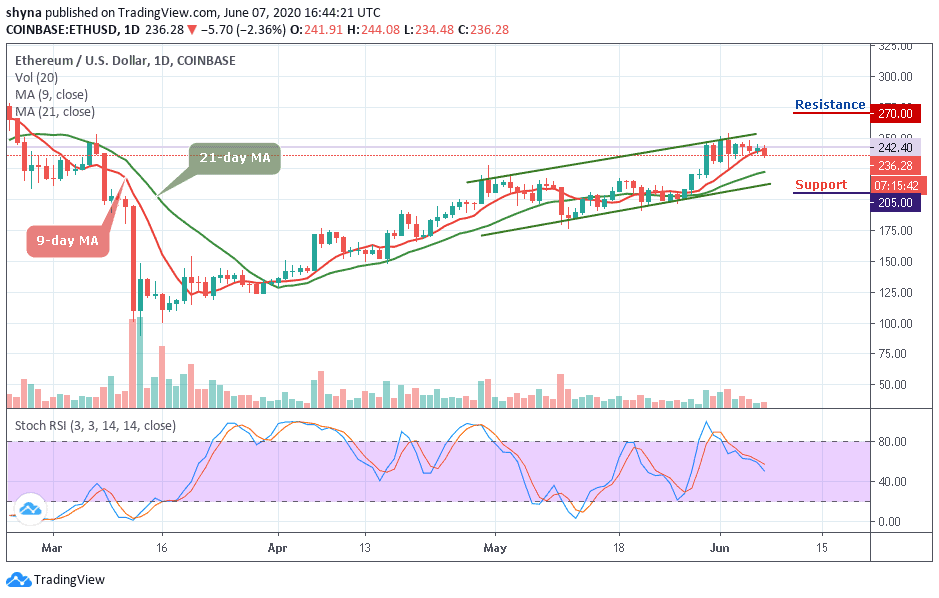
At the time of writing, ETH/USD is seen trading at $236 after touching $244 in the opening hour of today. Looking at the daily chart, Ethereum (ETH) has been trying to follow in the footsteps of the granddad of the digital market but its margin of gains has been limited this time around. ETH/USD is dancing at $236 after retreating from highs around $244, so is it time to buy Ethereum with PayPal.
Similarly, the highest value Ethereum has had within the last 10 days was $253 and today it touches the low of $234. ETH/USD can be expected to rise from $234 to $270 over the next one-week while the on-going trend may move a little bit higher in the coming week. More so, the Ethereum price may cross above the channel to touch the nearest resistance at $250.
Therefore, in as much as the red-line of 9-day MA is still well above the green-line of 21-day MA, the coin may continue to do well and the price could hit the target resistance levels at $270, $275, and $280 respectively. Meanwhile, as the technical indicator faces the south and the bearish drop may likely roll the market down to the support levels of $205, $200, and $195.
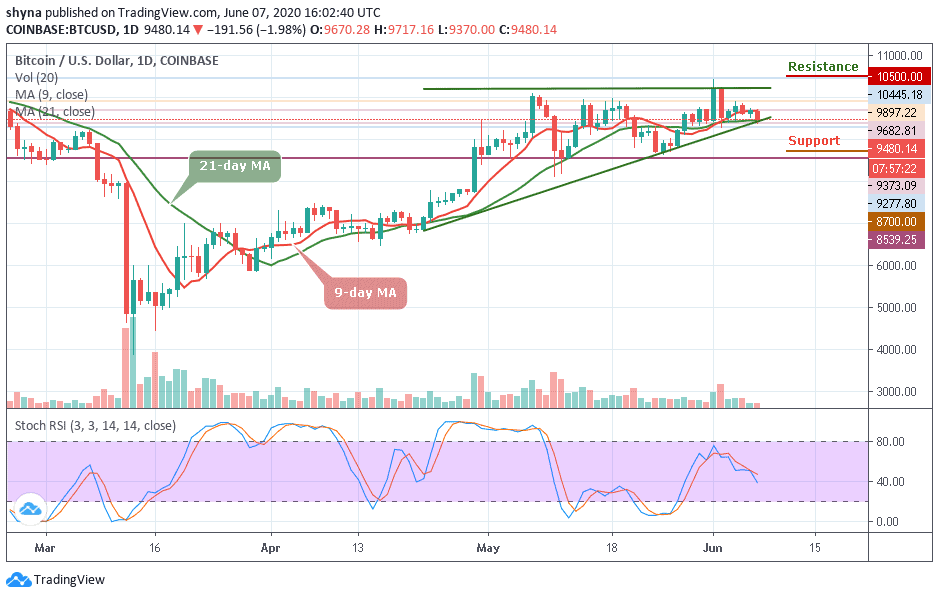
When compared with Bitcoin, as the green-line of 21-day MA is below the red-line of 9-day MA, the market price will continue to keep the uptrend. ETH/BTC is currently trading at the 2492 SAT and if the market continues to drop, the next key supports may likely be at 2300 SAT and below.
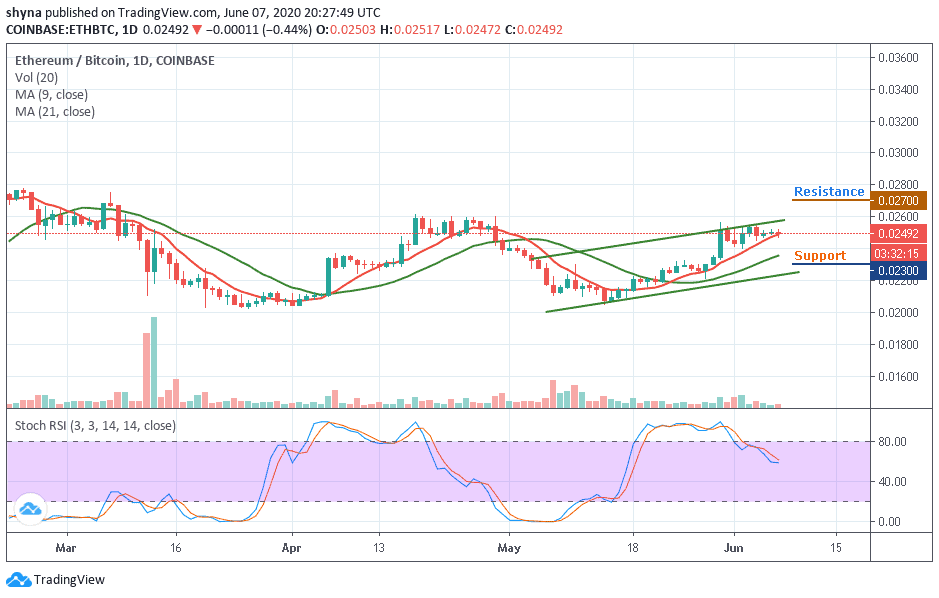
On the upside, a possible bullish movement above the channel may likely come into play, when this is done, the resistance level of 2700 SAT and above could be visited. Meanwhile, the market may have a bearish day because the stochastic RSI indicator moves below 60-level, which could give more bearish signals for a while.
Please note: Insidebitcoins.com is not a financial advisor. Do your research before investing your funds in any financial asset or presented product or event. We are not responsible for your investing results.
Join Our Telegram channel to stay up to date on breaking news coverage