Join Our Telegram channel to stay up to date on breaking news coverage
Bitcoin (BTC) Price Prediction – June 7
BTC/USD trades with a low of 1.98% over the past 24 hours as the cryptocurrency fails at $9,754 and heads lower.
BTC/USD Long-term Trend: Bullish (Daily Chart)
Key levels:
Resistance Levels: $10,500, $10,700, $10,900
Support Levels: $8,700, $8,500, $8,300
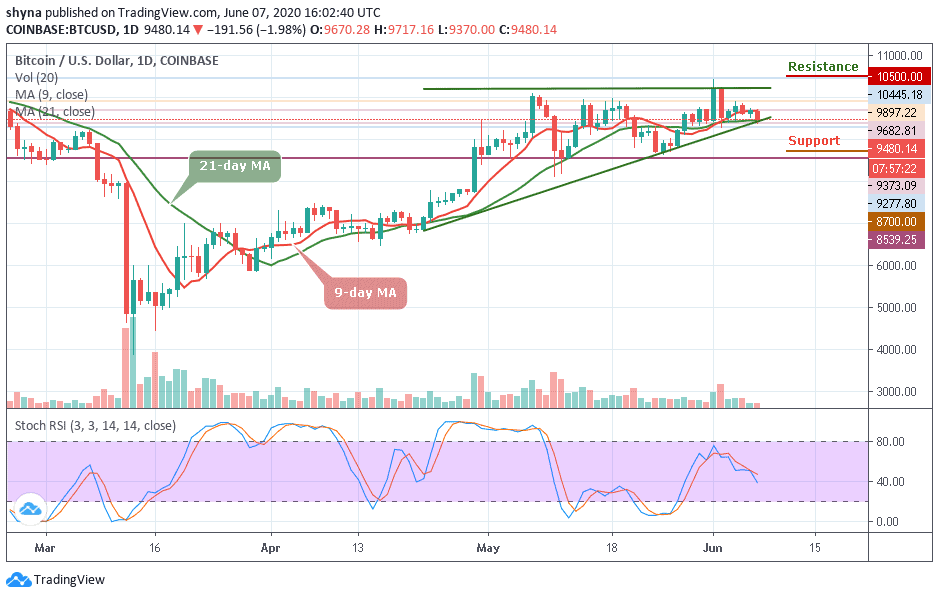
BTC/USD loses its momentum after touching key resistance above $9,754. At the time of writing, the pair is down with 1.98% on the day at $9,480 trading around the 9-day and 21-day moving averages within the channel. Meanwhile, looking at the daily chart, Bitcoin is struggling to close above $9,500 and it couldn’t, but once it does this, it should be free to rise well above $9,600 in the next positive directions.
However, we can see that in yesterday’s trading session, BTC/USD was unable to close above the resistance at $9,700. Moreover, in today’s session, the coin couldn’t push higher; the bears step-in and push it lower to reach the current level. Nevertheless, $9,000 serves as the nearest support level, which may likely make room for the coin to fall further with the supports of $8,700, $8,500, and $8,300.
In addition, the technical indicator stochastic RSI faces the south to indicate a downward movement. A further bearish movement is expected but on the upside range, if the bulls energize and push the price above $10,000, the upside range may resume and BTC/USD may likely see the resistance levels of $10,500, $10,700, and $10,900 if it crosses above the channel.
BTC/USD Medium-Term Trend: Ranging (4H Chart)
On the 4-Hour chart, BTC price hovers around $9,465 and may take time to persistently trade above $9,500. More so, if the bulls gather enough strength and regroup, the upward movement may be able to touch the resistance levels at $9,700, $9,900 and $10,100.
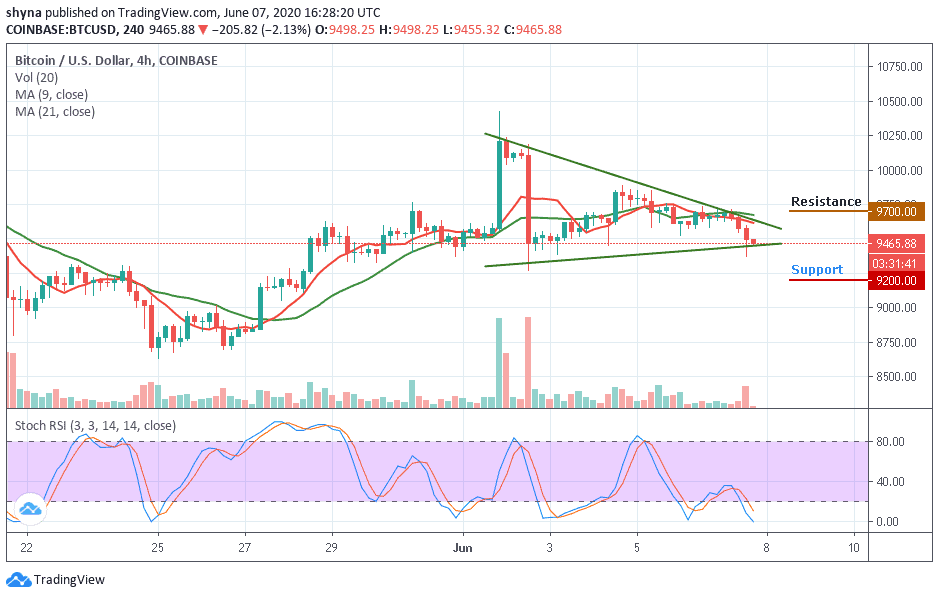
However, on the downside, immediate support is around the $9,400 level while the main support is at the $9,300 level. The price may likely fall below $9,200 if the bears pressurized the bulls, a further movement could reach the critical support at $9,000 level. Technically, BTC/USD is currently moving in sideways while the stochastic RSI moves into the oversold zone.
Please note: Insidebitcoins.com is not a financial advisor. Do your research before investing your funds in any financial asset or presented product or event. We are not responsible for your investing results.
Join Our Telegram channel to stay up to date on breaking news coverage