

Join Our Telegram channel to stay up to date on breaking news coverage
XRP Price Analysis – July 15
The bulls and bears are currently wrestling for control in the early hours of today.
XRP/USD Market
Key Levels:
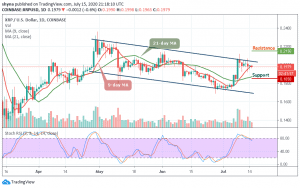
Resistance levels: $0.215, $0.220, $0.225
Support levels: $0.185, $0.180, $0.175

XRP/USD is slowly falling below the 9-day moving average. The Ripple price may likely touch the support of $0.180 before any further rise begins. After trying to stay above $0.206 a few days ago, XRP/USD has been declining slowly and steadily. Today, the coin moves under the $0.196 key support level to enter a short-term bear zone.
However, the Ripple (XRP) is currently trading at $0.197 and any attempt below the 9-day moving average could open the door to drop further and the price could fall below the $0.195 support level. However, we need to keep an eye on the $0.200 and $0.205 before moving upwards while the resistance levels lie at $0.215, $0.220, and $0.225.
Moreover, the market may experience a quick-buy as soon as the trade reaches the $0.195 support. And if the price fails to rebound, then a bearish breakout is likely to trigger more selling opportunity for traders, which might cause the price to retest $0.185 and could further drop to $0.180 and $0.175 support levels respectively. The stochastic RSI is moving out of the overbought zone, XRP/USD may drop further.
Against Bitcoin, the pair is consolidating within the channel and moving around the 9-day moving average. Meanwhile, the buyers attempt to push the price above the moving average and the bullish continuation may take it to the resistance levels of 2300 SAT and 2400 SAT respectively.

Moreover, looking at the chart, if the bulls failed to hold the price, then it may likely fall below the moving averages and the nearest support levels for the coin are 2000 SAT and 1900 SAT. The stochastic RSI is seen leaving the overbought territory, which indicates some bearish movement.
Join Our Telegram channel to stay up to date on breaking news coverage
