Join Our Telegram channel to stay up to date on breaking news coverage
Bitcoin (BTC) Price Prediction – July 15
The price of Bitcoin remains flat and it is unable to break above $9,300 or below $9,100.
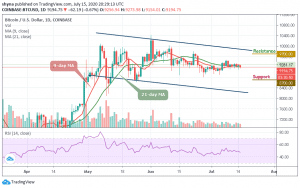
BTC/USD Long-term Trend: Ranging (Daily Chart)
Key levels:
Resistance Levels: $9,700, $9,900, $10,000
Support Levels: $8,700, $8,500, $8,300

While remaining as the most influential cryptocurrency, BTC/USD is technically supported by the $9,100 on short-term and $9,000 support on a medium-term. If the price of Bitcoin drops below these supports, we should expect long-term support at the $8,900 – the July 5 surge level. Considering the descending channel on the daily chart, the $9,500 resistance is an essential bullish breakout for the market.
Meanwhile, Bitcoin’s price is still roaming around the $9,194 following the bounce at $9,155 support during the price movement today. Looking at the daily price chart, we can see that the bearish supply has been turning slightly in the market, but the bulls are trying to defend the $9,100 – $9,300 supports as well. Meanwhile, the $9,500 may come into play if the coin breaks the mentioned supports.
However, the critical support level for the first digital coin is $9,000 at the moment. If the level breaks, we should see a bearish walk to the supports of $8,700, $8,500, and $8,300. Meanwhile, the $9,600 resistance is also a potential resistance level on the upside, but traders need to have a clear break at $9,700, $9,900, and $10,100 before we can consider a bull-run. The RSI indicator is currently moving sideways for the past few days now, reflecting that BTC/USD is in a consolidation mode.
BTC/USD Medium-Term Trend: Ranging (4H Chart)
Looking at the 4-hour chart, BTC/USD trades between $9,138 and $9,309. In the meantime, the coin is still expected to fall below $9,000 and it is making a bounce back. Meanwhile, Bitcoin’s price hovers around $9,208.99 and can take time to trade consistently above $9,250. The upward movement may likely reach the $9,300 and $9,500 resistance level.
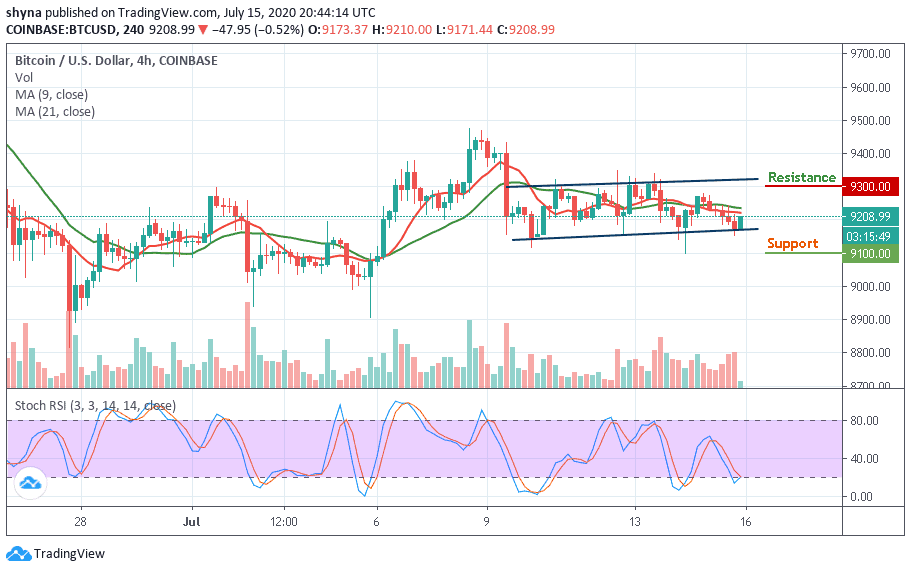
In other words, immediate support is close to the $9,150 level. More so, the price could drop drastically below $9,100, which could test another support at the $8,900 level and below. Technically, Bitcoin is currently moving sideways, while the stochastic RSI indicator is moving around 21-level.
Join Our Telegram channel to stay up to date on breaking news coverage