Join Our Telegram channel to stay up to date on breaking news coverage
The Ripple price prediction shows that XRP could renew the bullish trend after touching the resistance level of $0.529 today.
Ripple Prediction Statistics Data:
- Ripple price now – $0.52
- Ripple market cap – $26 billion
- Ripple circulating supply – 49.8 billion
- Ripple total supply – 99.98 billion
- Ripple Coinmarketcap ranking – #6
XRP/USD Market
Key Levels:
Resistance levels: $0.60, $0.62, $0.64
Support levels: $0.46, $0.44, $0.42
Your capital is at risk
XRP/USD regains ground after touching the daily high at $0.529 during the European session today. The Ripple price is currently changing hands at $0.520 with a slight gain of 0.54% since the start of the day. Despite the recovery, the coin is yet to cross above the upper boundary of the channel.
Ripple Price Prediction: Would Ripple Price Break to the Upside?
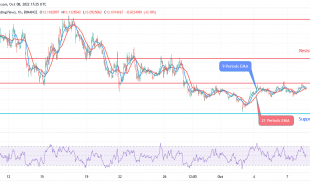
According to the daily chart, the Ripple price is moving towards the resistance level of $0.53 as the initial move above the channel could boost the price further up. The Ripple (XRP) hits the daily high at $0.529 before retreating to where it is currently trading. Looking from the above, more bullish movements are likely to come into play if the Ripple price stays above the 9-day and 21-day moving averages, and the nearest resistance level could be found at $0.55.
However, the traders can see that the daily movement remains in the hands of the bulls as the technical indicator Relative Strength Index (14) is seen moving above the 60-level, building on the consistent recovery from the downside. However, a break into the positive side may most likely push the coin towards the potential resistance levels of $0.60, $0.62, and $0.64; while a drop below the 9-day and 21-day moving averages may lead to the supports at $0.46, $0.44, and $0.42 respectively.
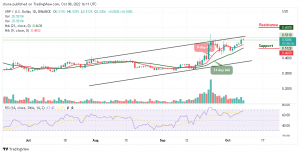
Against Bitcoin, Ripple is trading well above the 9-day and 21-day moving averages. After the coin touches the daily high at 2714 SAT today, the coin later retreated to where it is currently trading. Meanwhile, the price keeps moving sideways while the sellers may put pressure on the market.
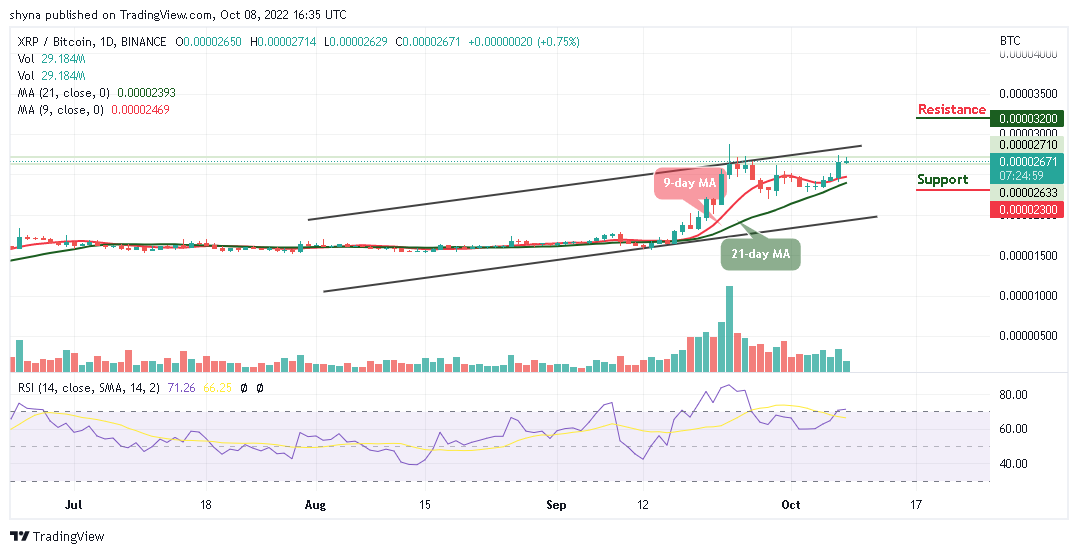
Moreover, should the price slide below the moving averages, the Ripple price may drop to the support of 2300 SAT and below. Now, the technical indicator Relative Strength Index (14) moves into the overbought region, any further bullish movement could hit the resistance level at $3200 and above.
Join Our Telegram channel to stay up to date on breaking news coverage