Join Our Telegram channel to stay up to date on breaking news coverage
Weak bullish movement in ATOM market
ATOMUSD Price Analysis – October 08
When ATOM break down the support level of $10, price may be expose to the low of $8 and $7 support levels. In case the support level of $10 holds, price may increase to the resistance level at $13, further increase in the bulls’ pressure may push up the price to $14 and $16 levels.
ATOM/USD Market
Key levels:
Resistance levels: $13, $14, $16
Support levels: $10, $8, $7
ATOMUSD Long-term Trend: Bearish
ATOMUSD is bearish on the daily chart. Atom has formed a bearish chart pattern on the daily chart called double top. This is noticed at the resistance level of $16. Sellers took over the market with the formation of bearish engulfing candles. The crypto penetrates the former support levels of $14 and $13. The bearish trend extends to $10 support level where it is currently pulling back.
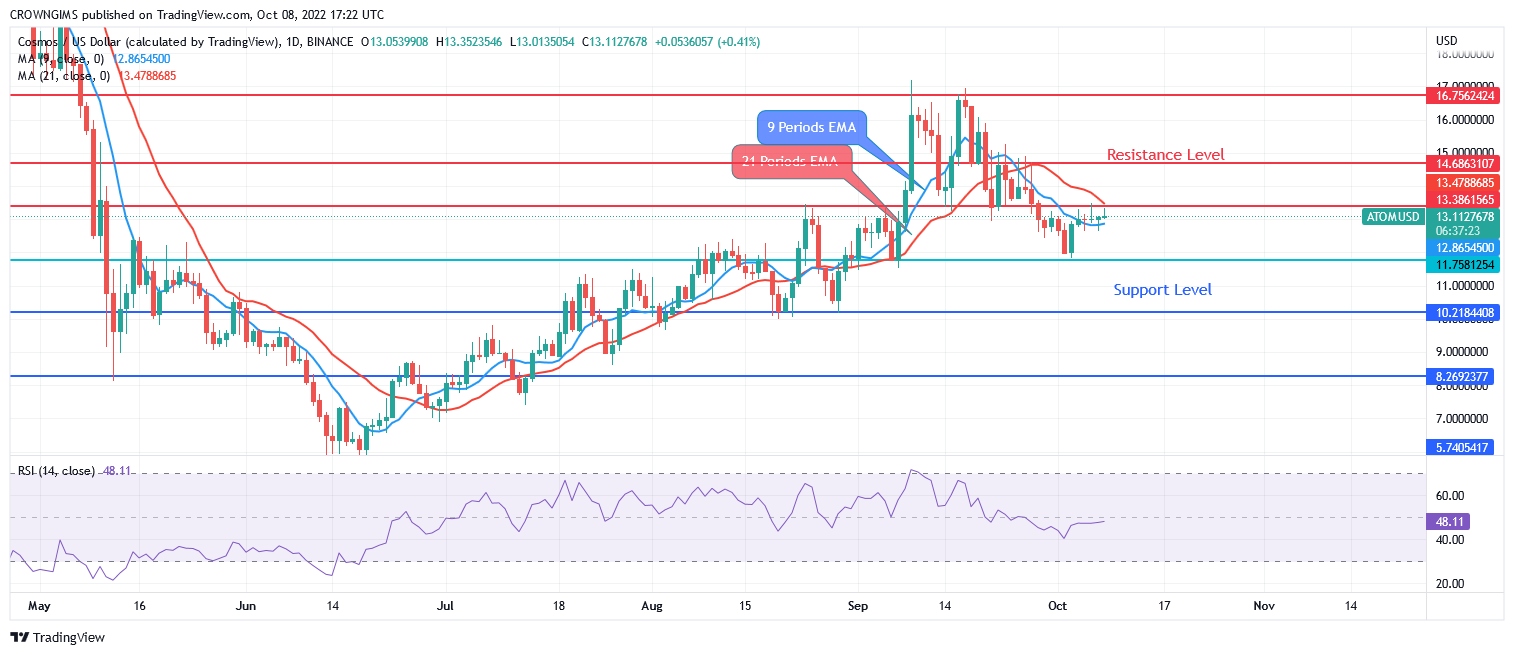
The price is trading below the two EMAs as a sign of bearish movement. The fast Moving Average (9 periods) is below the slow Moving Average (21 periods EMA) and are separated. When Cosmos break down the support level of $10, price may be expose to the low of $8 and $7 support levels. In case the support level of $10 holds, price may increase to the resistance level at $13, further increase in the bulls’ pressure may push up the price to $14 and $16 levels.
Your capital is at risk
ATOMUSD medium-term Trend: Bearish
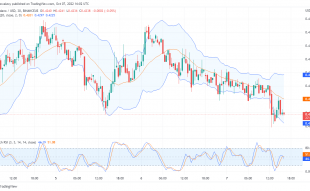
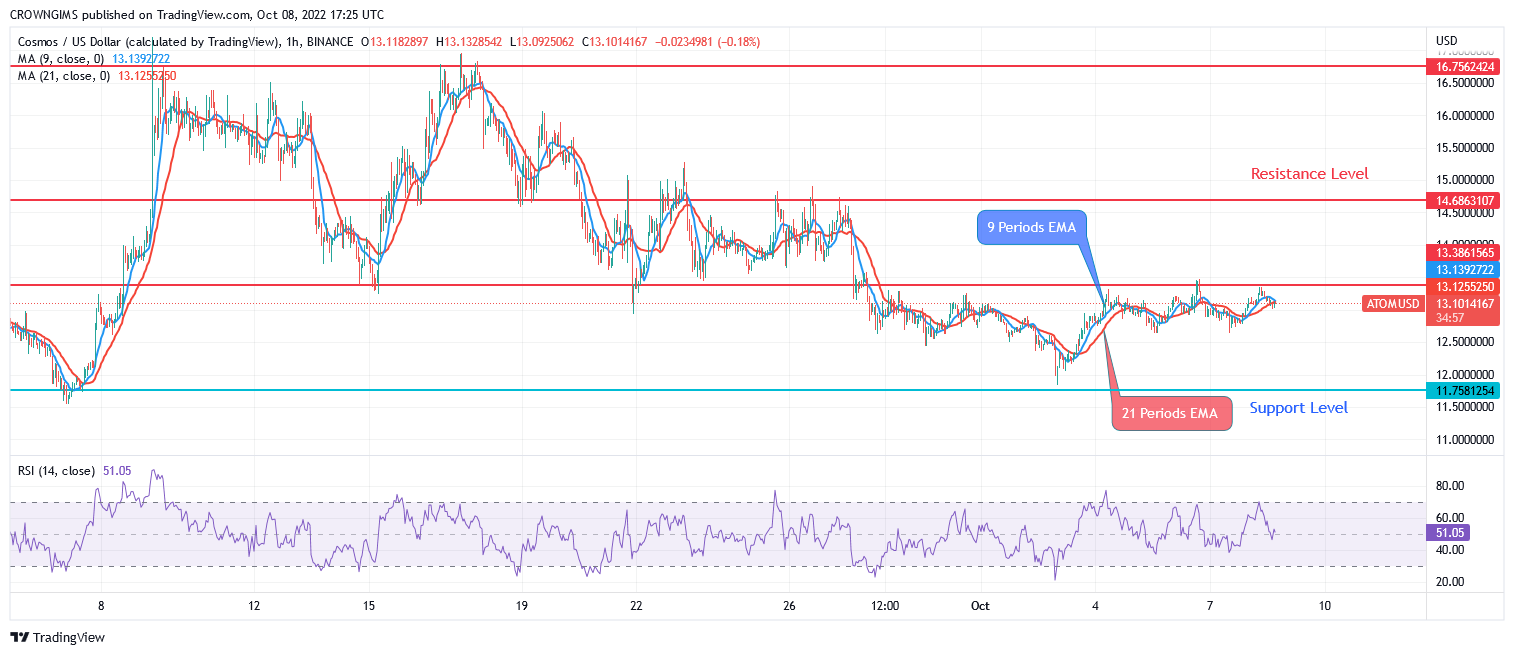
ATOMUSD is bearish in the 4-hour chart. When Cosmos repelled from the resistance level of $16, it could not increase further, bears gained momentum at $16 level. Sellers’ pressure pushed the price to the low of $13. The just mentioned level holds coupled with low momentum from the sellers to push down the price. The ranging movement within $13 and $11 levels commenced.
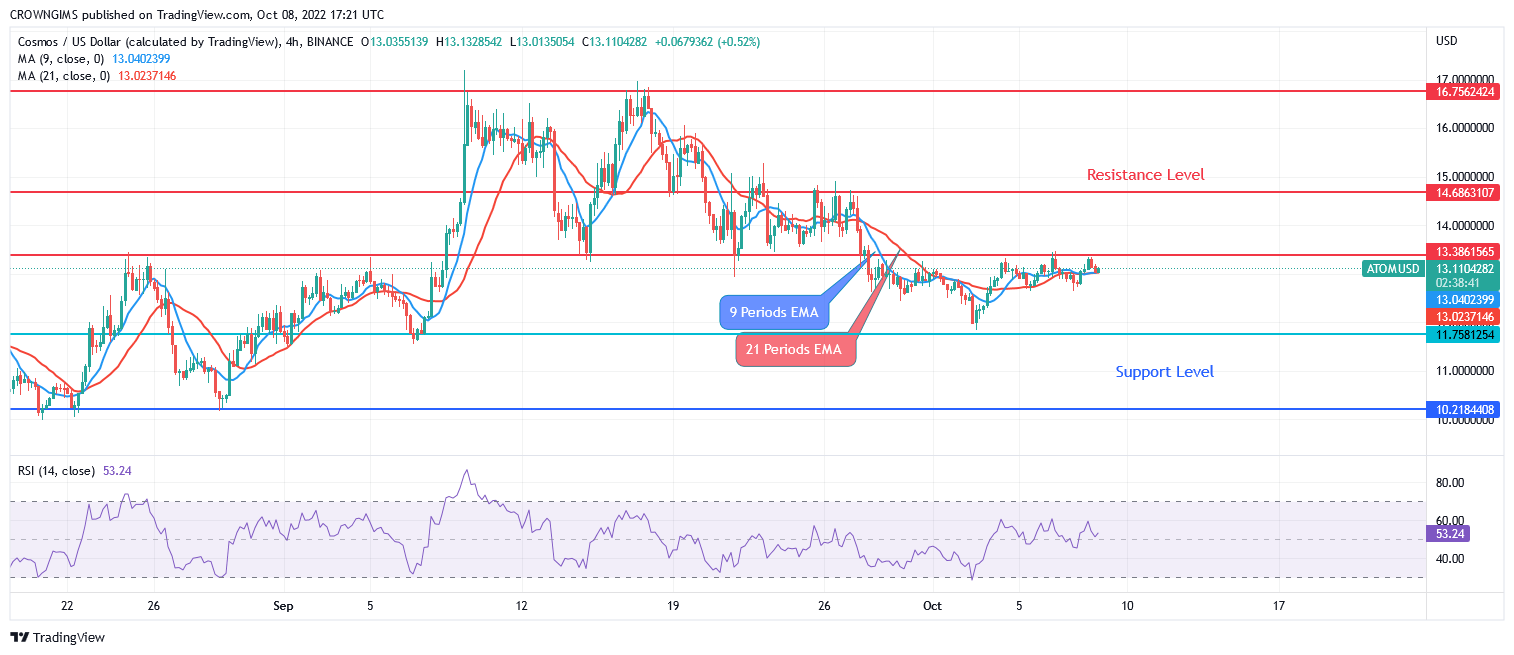
The two EMAs are interlocked to each other and the currency pair is hovering over the 21 periods EMA and 9 periods EMA which indicates that ranging movement is in progress. The relative strength index period 14 is at 55 levels and the signal lines display no specific direction.
Join Our Telegram channel to stay up to date on breaking news coverage