Join Our Telegram channel to stay up to date on breaking news coverage
The Ripple price prediction has not been able to develop the upside momentum above $0.50 as the coin range-bounds within the market.
Ripple Price Statistics Data:
- Ripple price now – $0.46
- Ripple market cap – $23.1 billion
- Ripple circulating supply – 49.8 billion
- Ripple total supply – 99.9 billion
- Ripple Coinmarketcap ranking – #6
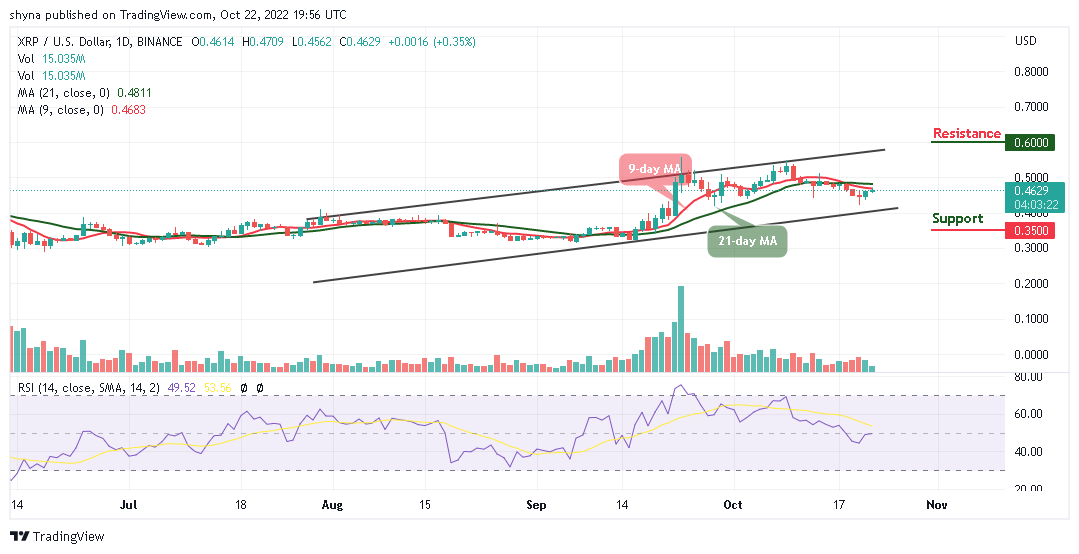
XRP/USD Market
Key Levels:
Resistance levels: $0.60, $0.65, $0.70
Support levels: $0.35, $0.30, $0.25
XRP/USD touches the resistance level of $0.46 at the opening of the market today, but the coin failed to cross above the 21-day moving average as it quickly retreated towards $0.45 support. Nonetheless, Ripple (XRP) may begin to move sideways which could limit its bullish movements below the 9-day and 21-day moving averages.
Ripple Price Prediction: What could be the Next Direction?
As revealed by the daily chart, the Ripple price may begin to follow the same direction as the coin moves toward the east. However, if the bulls manage to push XRP/USD above the 21-day moving average; the coin could locate the potential resistance at $0.60, $0.65, and $0.70 levels.
Meanwhile, if the market follows the bearish movement, it may likely hit the nearest support at $0.38, and a further drop could pull XRP/USD to the support levels of $0.35, $0.30, and $0.25 respectively. Moreover, the technical indicator Relative Strength Index (14) confirms the sideways movement as the signal line moves within the 50-level. Therefore, traders should keep monitoring the movement for the next possible direction of the Ripple price.
When compares with Bitcoin, the Ripple price is seen moving sideways, although the price action has remained intact below the 9-day and 21-day moving averages. Meanwhile, if the selling pressure persists, the Ripple price variation may create a new low for the coin in the next coming trading days. However, if a bullish movement continues and validates a break above the 9-day and 21-day moving averages; traders may confirm a bullish movement for the market, and the nearest resistance level may be located at 3200 SAT and above.
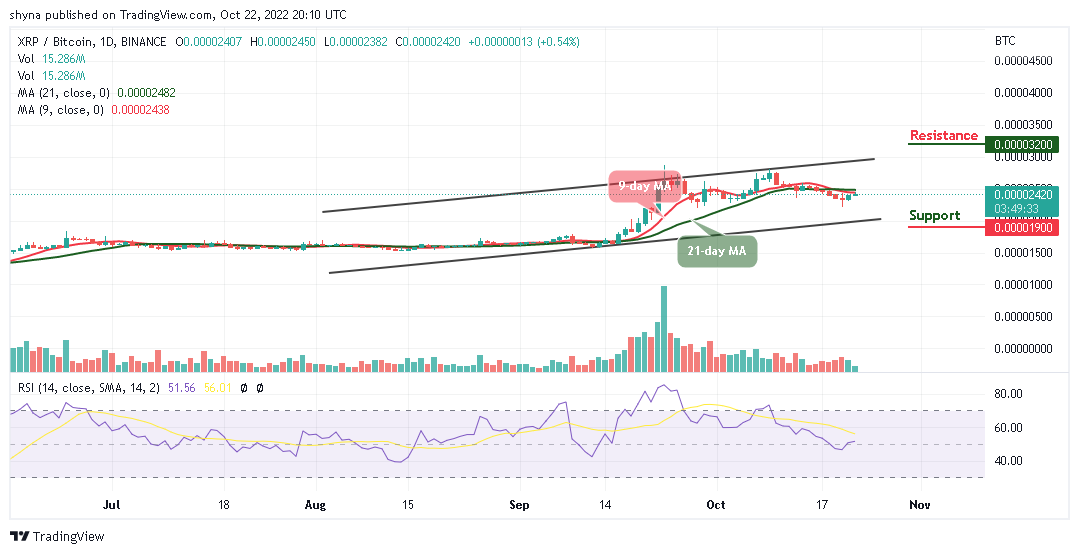
At the moment, the technical indicator Relative Strength Index (14) is seen moving in the same direction above the 50-level; traders may continue to see a positive move if the bulls increase their movement and traders should expect close resistance at the 3000 SAT. On the contrary, if the coin crosses below the lower boundary of the channel, it could drag the coin to the critical support of 1900 SAT and below.
Presently, the IMPT token is above halfway through its presale and has been spectacularly successful so far, having raised around $6 million.
Stage one of the Dash2Trade presale has been sold out and this took less than 4 days. At the moment, D2T is still cheap at 0.05 USDT in stage two, the amount raised so far approaches $2 million.
Related:
Join Our Telegram channel to stay up to date on breaking news coverage