
Join Our Telegram channel to stay up to date on breaking news coverage
The Ripple (XRP) price prediction may begin to show a bullish movement if the market could rise above the $0.50 resistance level.
Ripple (XRP) Statistics Data:
- Ripple price now – $0.48
- Ripple market cap – $24 billion
- Ripple circulating supply – 49.9 billion
- Ripple total supply – 99.9 billion
- Ripple Coinmarketcap ranking – #6
XRP/USD Market
Key Levels:
Resistance levels: $0.60, $0.65, $0.70
Support levels: $0.40, $0.35, $0.30
Your capital is at risk
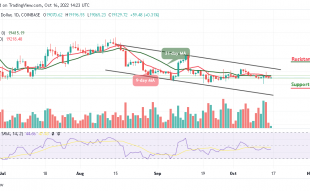
XRP/USD is moving sideways as the market remains below the 9-day and 21-day moving averages. Apart from this, the Ripple price still needs to conquer the resistance level of $0.50 within the channel so that the price can rise as soon as this is done.
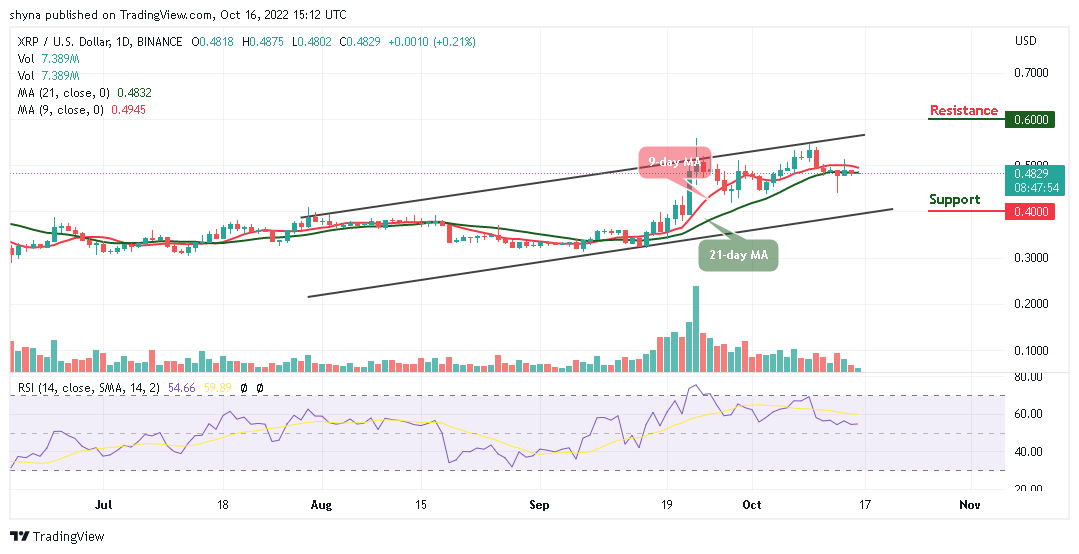
Ripple Price Prediction: XRP/USD Could Shoot to the North
The daily chart shows that the Ripple price is attempting to create a new positive trend, and traders may expect a bullish continuation towards the upside, which could test the resistance level of $0.50. Similarly, the technical indicator Relative Strength Index (14) remains above the 50-level; crossing above the upper boundary of the channel may locate the potential resistance levels at $0.60, $0.65, and $0.70 in the long term.
Moreover, as soon as the Ripple price spikes to the upside, traders may witness additional bullish trends in the coming trading sessions. On the contrary, a bearish breakdown may likely play out if the Ripple price withdraws back and head towards the lower boundary of the channel, this could roll the coin back to the long-term supports at $0.40, $0.35, and $0.30 respectively.
Against Bitcoin, the Ripple price follows the sideways movement as the coin trades within the 9-day and 21-day moving averages. More so, if the pair touches the support level of 2400 SAT, the market is likely to keep releasing more bearish pressure as the technical indicator Relative Strength Index (14) crosses below the 60-level, which indicates that more bearish signals are likely to play out.
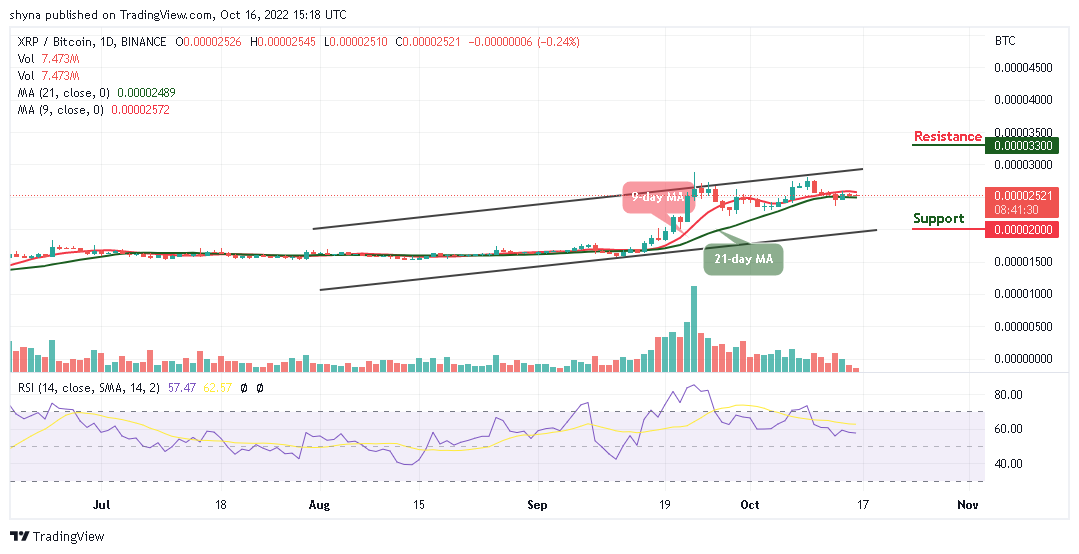
However, if XRP/BTC spikes above the moving averages, it may push the coin to the nearest resistance at 2800 SAT, and any further bullish movement could push the price to the resistance level of 3300 SAT and above. Nevertheless, if the coin continues to follow a bearish movement, crossing below the lower boundary of the channel could hit the support level of 2000 SAT and below.
Join Our Telegram channel to stay up to date on breaking news coverage