
Join Our Telegram channel to stay up to date on breaking news coverage
The Ripple price prediction continues to battle with the $0.80 level after being supported by the 9-day and 21-day moving averages.
Ripple Prediction Statistics Data:
- Ripple price now – $0.39
- Ripple market cap – $20.1 billion
- Ripple circulating supply – 50.95 billion
- Ripple total supply – 99.9 billion
- Ripple Coinmarketcap ranking – #6
XRP/USD Market
Key Levels:
Resistance levels: $0.43, $0.45, $0.47
Support levels: $0.34, $0.32, $0.30
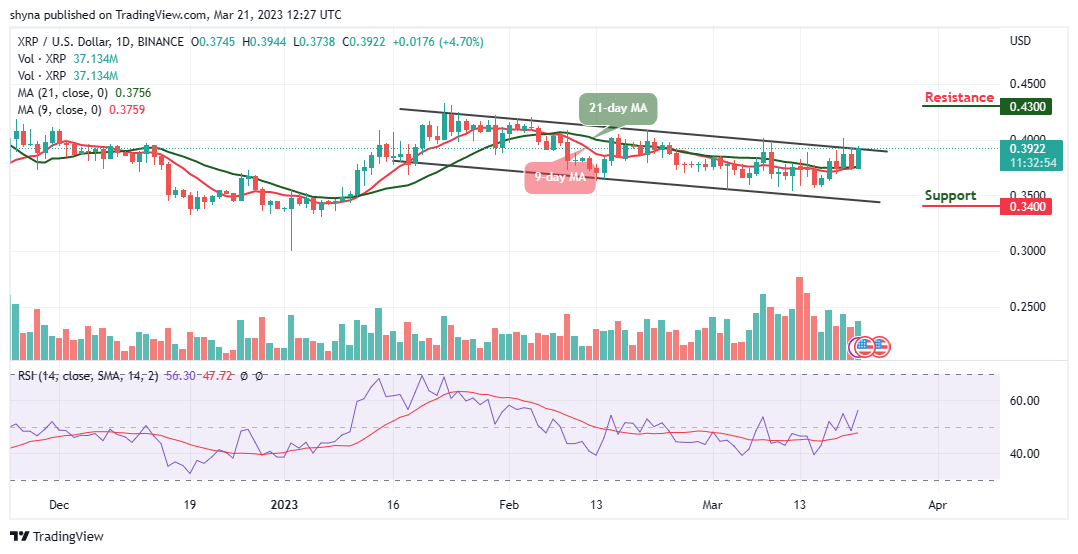
At the time of writing, XRP/USD is seen trading at $0.39 above the 9-day and 21-day moving averages. Since the past few weeks, the Ripple price has been moving sideways as it continues to struggle to cross above the upper boundary of the channel. However, the attempt to push the coin to the upside shows that the bulls are battling to step back into the market.
Ripple Price Prediction: Would Ripple (XRP) Head to the Upside?
According to the daily chart, the Ripple price may cross above the channel to hit the nearest resistance level of $0.40 if the bulls put more pressure. Any additional movement above this barrier could reach the important resistance level of $0.42. If the Ripple price can break above this level, higher resistance could be located at $0.43, $0.45, and $0.47.
Meanwhile, if the price decides to cross below the 9-day and 21-day moving averages, the nearest support to reach could be found at the $0.36 level. Beneath this, further supports could be located at $0.34, $0.32, and $0.30. However, the technical indicator Relative Strength Index (14) is moving to cross above the 50-level as traders wait for a bullish crossover to push the market higher. On the contrary, the coin may visit the negative side, if the 9-day MA crosses below the 21-day MA.
Against Bitcoin, the Ripple price keeps moving below the 9-day and 21-day moving averages as the nearest support level lies around the lower boundary of the channel. However, if the buyers push the Ripple (XRP) above the moving averages, the potential resistance level could be located at 1700 SAT and above.
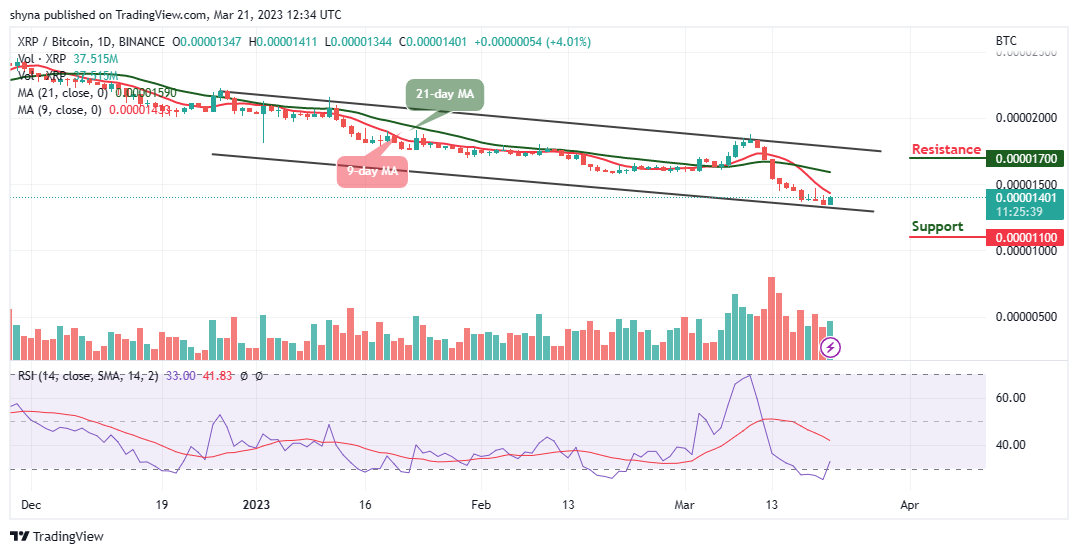
In other words, the market price may remain below the moving averages to give additional bearish signals; therefore, if the coin crosses below the lower boundary of the channel, it can hit the support level of 1100 SAT and below. Meanwhile, the market may head to the upside as the technical indicator Relative Strength Index (14) recovers from the oversold region.
Alternatives to Ripple
The Ripple price remains the sixth-largest cryptocurrency with a market cap of $20.2 billion. The coin begins to see another increase in the market, and it is currently trading above the 9-day and 21-day moving averages. However, LHINU has proved to be one of the most promising meme coins in the market at the moment. In the ongoing presale, almost $2 million has been raised. Therefore, the more Love Hate Inu (LHINU) staked by a member, the more their overall voting power increases.
Read more:
- Ripple Price Prediction: XRP/USD Struggles to Hold Above $1.16 Resistance as Selling Pressure Mounts
Join Our Telegram channel to stay up to date on breaking news coverage