
Join Our Telegram channel to stay up to date on breaking news coverage
The Bitcoin price prediction shows that BTC rebounds from the early dip at $27,527 as the buying interest may increase approach to $29,000.
Bitcoin Price Prediction Statistics Data:
- Bitcoin price now – $28,287
- Bitcoin market cap – $540.6 billion
- Bitcoin circulating supply – 19.3 million
- Bitcoin total supply – 19.3 million
- Bitcoin Coinmarketcap ranking – #1
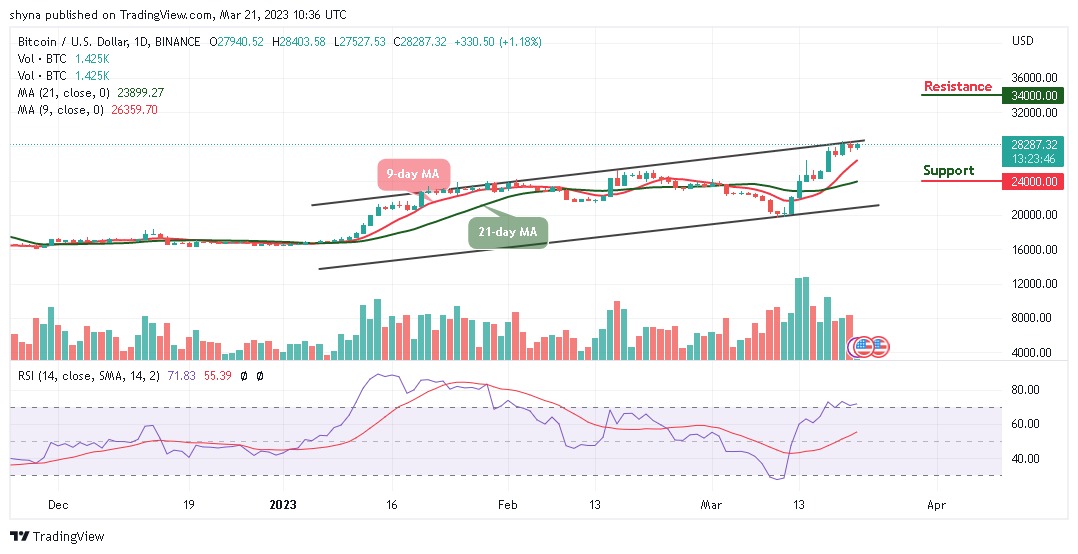
BTC/USD Long-term Trend: Bullish (Daily Chart)
Key levels:
Resistance Levels: $34,000, $36,000, $38,000
Support Levels: $24,000, $22,000, $20,000
BTC/USD is trading above the 9-day and 21-day moving averages as the market establishes a slight rise above $28,000 but currently rebounding to retest previous resistance at $28,400. The bulls may continue to find some resistance levels near the upper boundary of the channel on the road to recovery and the path of least resistance appears to the upside in the near term amid a favorable bullish technical setup.
Bitcoin Price Prediction: BTC Price Could Spike Higher
In the past few hours, after the Bitcoin price touches the daily low of $27,527, the king coin is facing the resistance level of $28,500 and looking forward to hitting the resistance level of $29,000. However, the daily chart also shows that if the 9-day moving average remains above the 21-day moving average, this will confirm the next direction that the coin will follow. In other words, BTC/USD may decline if the Bitcoin price break below the 9-day and 21-day moving averages.
Meanwhile, the technical indicator Relative Strength Index (14) is moving within the overbought region, indicating a bullish movement. Therefore, if the Bitcoin price crosses above the channel, it could hit the resistance levels of $34,000, $36,000, and $38,000 but any movement below the moving averages could hit the supports at $24,000, $22,000, and $20,000.
BTC/USD Medium-term Trend: Ranging (4H Chart)
According to the 4-hour chart, the Bitcoin price is seen moving sideways as the technical indicator Relative Strength Index moves to cross above the 60-level. On the upside, if the Bitcoin price crosses above the 9-day and 21-day moving averages in the short term, bullish influence could spike and the accrued gains massively.
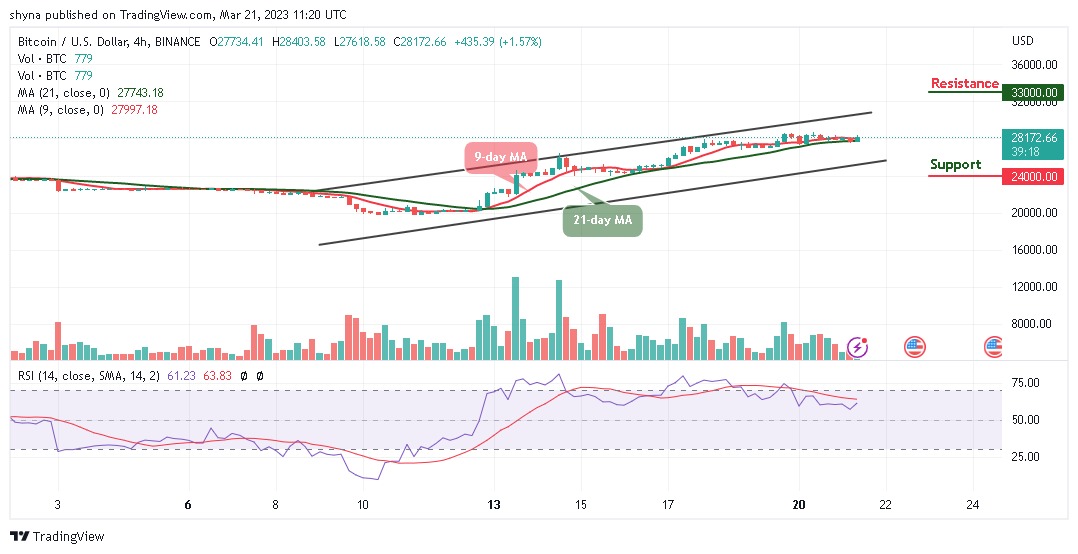
However, the current candle may target the support level at $24,000 and below but the best the bulls can do is to hold above the resistance level of $28,000 and keep their attention on breaking the potential resistance at $33,000 and above.
Alternatives to Bitcoin
The Bitcoin price is beginning to see some signs of immense strength as buyers propel it up towards $29,000. Meanwhile, the king coin has not been able to climb the $28,500 as neither the bulls nor the bears are looking to hold the price by the scruff of its neck. Actually, Love Hate Inu (LHINU) is making waves in the market by introducing a novel concept that has never been explored before. If you’re going to buy this new crypto on presale, it is better you do so now as almost $2 million has raised in the ongoing presale.
Join Our Telegram channel to stay up to date on breaking news coverage