Join Our Telegram channel to stay up to date on breaking news coverage
The Bitcoin price prediction reveals that BTC is retracing its recent losses, and it’s correcting gains and might decline towards the $27,000 support.
Bitcoin Prediction Statistics Data:
- Bitcoin price now – $28,238
- Bitcoin market cap – $542.6 billion
- Bitcoin circulating supply – 19.3 million
- Bitcoin total supply – 19.3 million
- Bitcoin Coinmarketcap ranking – #1
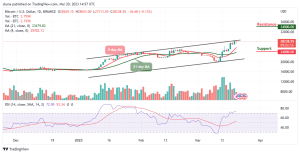
BTC/USD Long-term Trend: Bullish (Daily Chart)
Key levels:
Resistance Levels: $34,000, $36,000, $38,000
Support Levels: $24,000, $22,000, $20,000
BTC/USD begins a steady increase above the resistance level of $28,300 as the king coin touches the daily high at $28,653 level and settled above the 9-day and 21-day moving averages. The bulls may continue to find some resistance levels above the upper boundary of the channel on the road to recovery.
Bitcoin Price Prediction: BTC Price May Create More Gains
The Bitcoin price touches the daily low of $27,313, which is below the opening price of today. The king coin is likely to face the resistance level of $29,000 by looking forward to reclaiming the resistance level of $28,600. Besides, there was a break below a major bullish trend line with support near $27,500 on the daily chart of the BTC/USD pair. Nevertheless, the Bitcoin price is still hovering above $28,200 and the 9-day and 21-day moving averages.
Meanwhile, the technical indicator Relative Strength Index (14) is moving within the overbought region, indicating a bullish movement. Therefore, if the Bitcoin price crosses above the upper boundary of the channel, it could hit the resistance levels of $24,000, $26,000, and $28,000, but any movement below the moving averages could hit the supports at $24,000, $22,000, and $20,000.
BTC/USD Medium-term Trend: Bullish (4H Chart)
According to the 4-hour chart, the Bitcoin price may head to the downside as the technical indicator Relative Strength Index (14) faces the 60-level. On the upside, if the Bitcoin price stays above the 9-day moving average in the short term, bullish influence could spike, and the accrued gains massively.
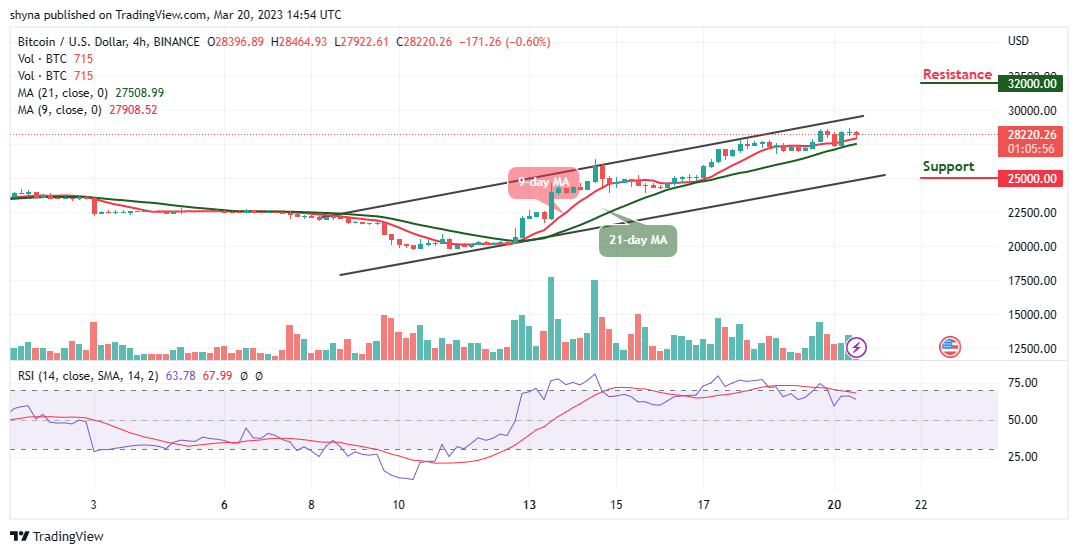
However, the current candle may target the support level at $25,000 and below, but the best the bulls can do is to hold the current market value of $28,200 and keep their attention on breaking the potential resistance at $32,000 and above.
Alternatives to Bitcoin
The Bitcoin price movement on the daily chart has reflected improvement and if the same remains locked, then the expectation of additional recoveries could turn out to be true. Moreover, if the market decides to follow the downward trend, the Bitcoin price may likely slide toward the lower boundary of the channel. However, the LHINU token powers the whole Love Hate Inu ecosystem. It is an ERC 20 token that can be staked for rewards when you vote on polls powered by Love Hate Inu. LHINU has opted for a minimalistic approach to tokenomics as the token has raised almost $2m in the ongoing presale.
Join Our Telegram channel to stay up to date on breaking news coverage