
Join Our Telegram channel to stay up to date on breaking news coverage
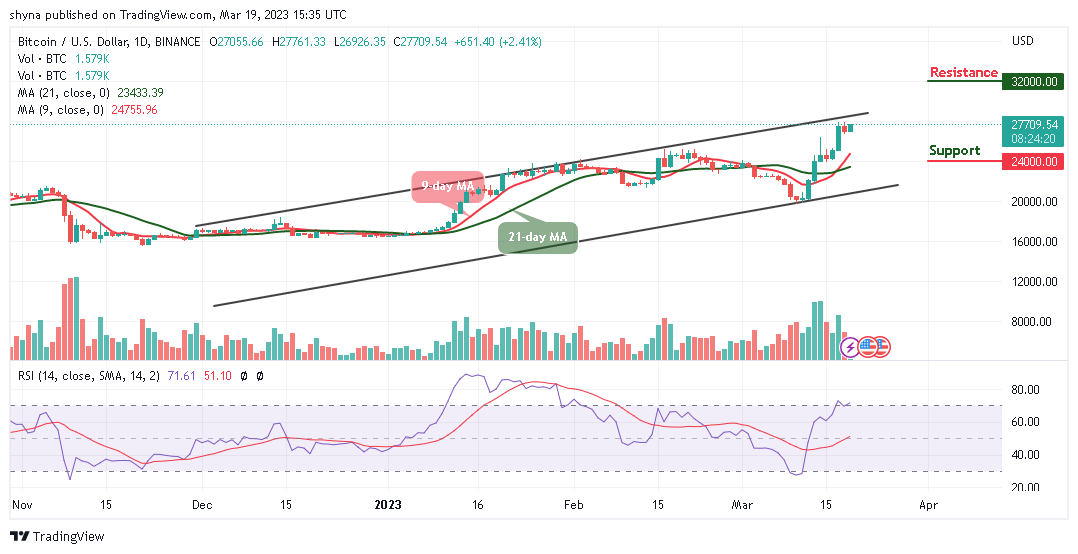
Looking at the daily chart, the Bitcoin price prediction is showing positive signs, and it is likely to accelerate further higher in the near term.
Bitcoin Prediction Statistics Data:
- Bitcoin price now – $27,709
- Bitcoin market cap – $533 billion
- Bitcoin circulating supply – 19.3 million
- Bitcoin total supply – 19.3 million
- Bitcoin Coinmarketcap ranking – #1
BTC/USD Long-term Trend: Bullish (Daily Chart)
Key levels:
Resistance Levels: $32,000, $34,000, $35,000
Support Levels: $24,000, $22,000, $20,000
According to the daily chart, BTC/USD breaches $27,000 as the new month’s high beckons. The king coin is seen trading well above the 9-day and 21-day moving averages at $27,709. Moreover, the Bitcoin price is within touching distance of forming a new daily high above the previous high of $27,000, which is quite remarkable.
Bitcoin Price Prediction: Where is Bitcoin Price Going Next?
At the moment, the Bitcoin price is trading comfortably towards the upper boundary of the channel as the price establishes a new bullish signal. Meanwhile, one could say that the long-term outlook favors the bulls, giving the daily close produced a large bullish engulfing candle with eyes now set on the daily resistances at $32,000, $34,000, and $36,000 respectively.
Furthermore, any drop from the current level could lead to declines in the critical support below the 9-day and 21-day moving averages. However, in case BTC drops and touches the low of $25,000 support, then the king coin can rely on the long-term support levels at $24,000, $22,000, and $20,000. Moreover, the technical indicator Relative Strength Index (14) is now moving within the overbought region, suggesting more bullish signals.
BTC/USD Medium-term Trend: Ranging (4H Chart)
According to the 4-hour chart, the Bitcoin price is seen trading above the 9-day and 21-day moving averages at $27,682. However, today’s price move happens to be an impressive one as it climbs above the long-awaited resistance level of $27,500 with a sharp upsurge. Moreover, BTC/USD is now maintaining its bull run as the technical indicator Relative Strength Index (14) moves to cross above the 70-level.
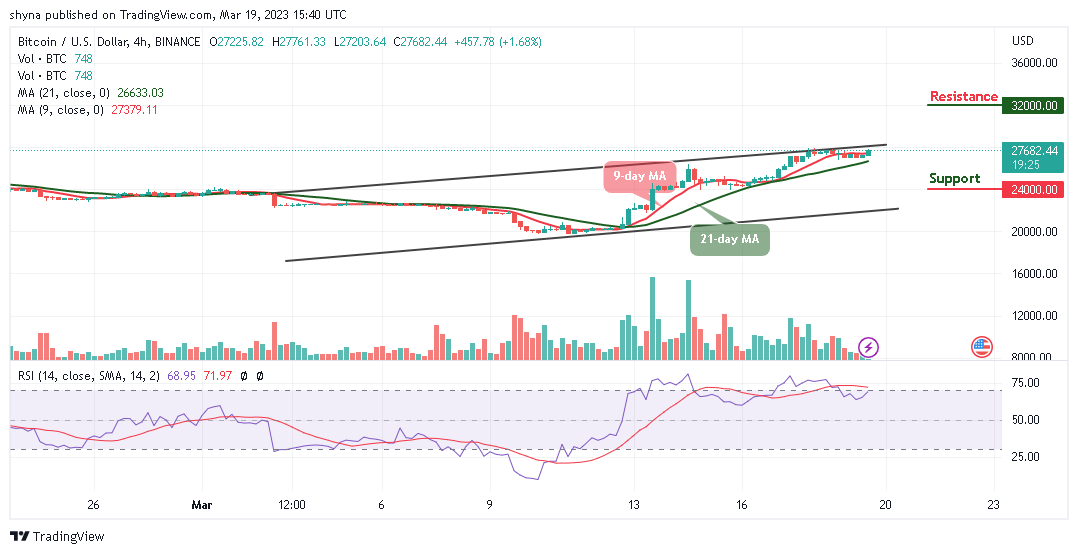
However, BTC may take a downward move if the bulls failed to push the price higher, and the coin may breach below the 9-day and 21-day moving averages, which could reach another support at $24,000 and below. Nevertheless, if the bulls find a decent resistance level of around $28,000, the coin may continue the bullish movement by crossing above the channel to hit the resistance level of $32,000 and above.
Alternatives to Bitcoin
At the time of writing, the Bitcoin price could gain more upsides if there is a clear move above the $28,000 resistance. However, the first digital asset could rise further if there is a strong bullish movement that crosses above the upper boundary of the channel. However, we have a new challenger arriving in the highly competitive meme coin sector and its name is Love Hate Inu (LHINU). This token is an exciting Ethereum-based meme coin project that lets you share your opinions about hot topics and earn rewards as almost $2 million has been raised so far in the presale.
Join Our Telegram channel to stay up to date on breaking news coverage