Join Our Telegram channel to stay up to date on breaking news coverage
XRP Price Prediction – May 20
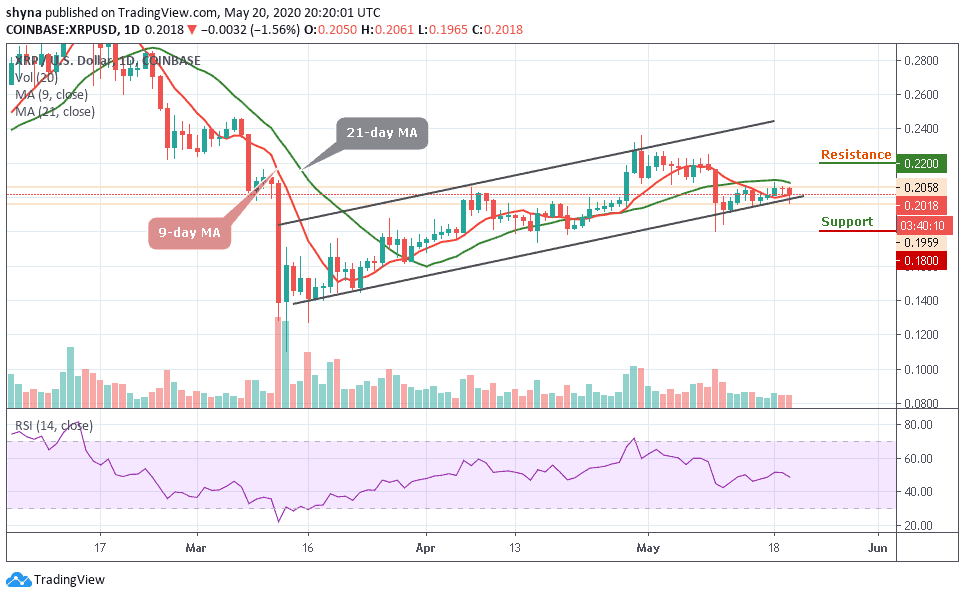
Looking at the daily chart, Ripple (XRP) is down with 1.56% as the value touches $0.195 support.
XRP/USD Market
Key Levels:
Resistance levels: $0.22, $0.23, $0.24
Support levels: $0.18, $0.17, $0.16
XRP/USD may continue to show weakness in price and fall at support until the market can find a stable level to reinforce bullish run. For now, a new low is yet to be ascertained as the bears remain dominant and active. Traders may need to wait for the sellers to exhaust momentum before longing. However, shorting XRP might be the best position for now.
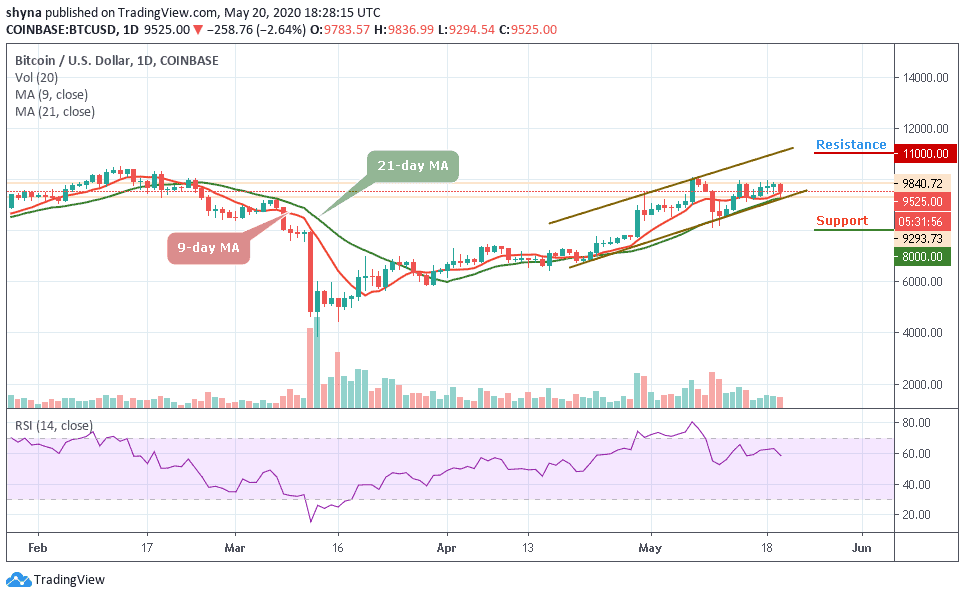
At the moment, the buy Ripple price continues to demonstrate a sign of weakness across its markets. As the RSI (14) moves below 50-level, the XRP/USD market is down by 1.56%, reflecting a price drop in the market and the fall might become heavy if the bearish action continues. Meanwhile, the Ripple (XRP) has witnessed a bullish drive against USD for more than three weeks.
Therefore, since the XRP/USD is moving bullishly on short-term outlook, traders can expect the trend to keep advancing higher if the price actions still remain above the 9-day and 21-day moving averages. A breakout above the moving averages could strengthen bulls and push the price towards the resistance levels of $0.22, $0.23 and $0.24 while a channel breakdown might lead the market in a bearish scenario and the closest supports to keep an eye on are $0.18, $0.17, and critically $0.16.
Against BTC, XRP moves at the downside, actually, the price action remains intact within the channel. If the selling pressure continues, the XRP price variation may create a new monthly low. At the moment, the signal line of RSI (14) is moving out of the negative side (oversold zone); we may continue to see a negative move in the market as much as the coin continues to trade below the moving averages.
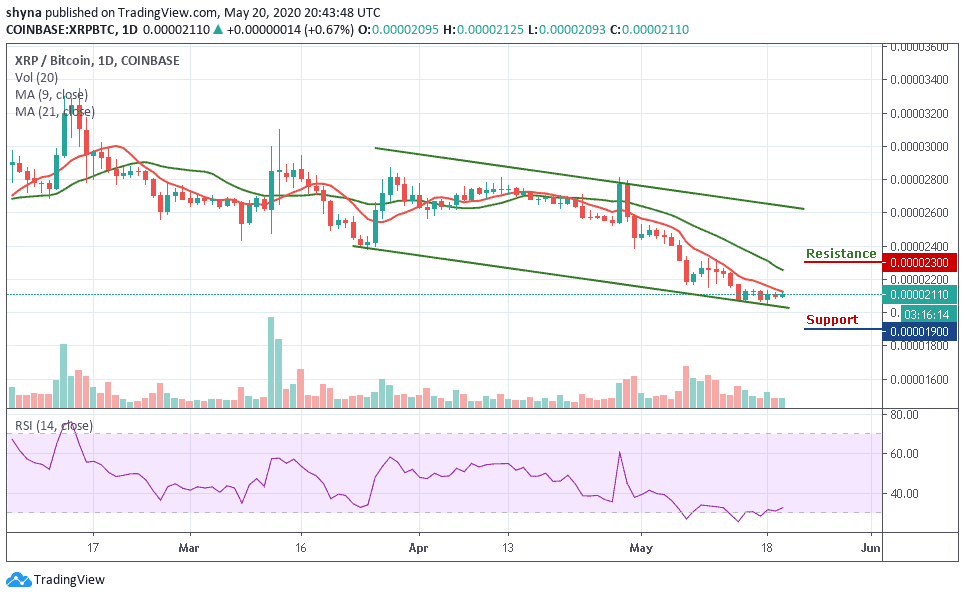
However, XRP/BTC is currently moving at 2110 SAT which is around the lower boundary of the channel. Traders may expect close support at 2000 SAT before breaking to 1900 SAT and critically 1800 SAT. Should in case a bullish movement occurs and validates a break above the moving averages; we can then confirm a bull-run for the market and the nearest resistance levels to reach lies at 2300 SAT and above.
Please note: Insidebitcoins.com is not a financial advisor. Do your research before investing your funds in any financial asset or presented product or event. We are not responsible for your investing results.
Join Our Telegram channel to stay up to date on breaking news coverage