Join Our Telegram channel to stay up to date on breaking news coverage
Bitcoin (BTC) Price Prediction – May 20
After four straight bullish days, BTC/USD bears are taking control of the market.
BTC/USD Long-term Trend: Bullish (Daily Chart)
Key levels:
Resistance Levels: $11,000, $11,200, $11,400
Support Levels: $8,000, $7,800, $7,600
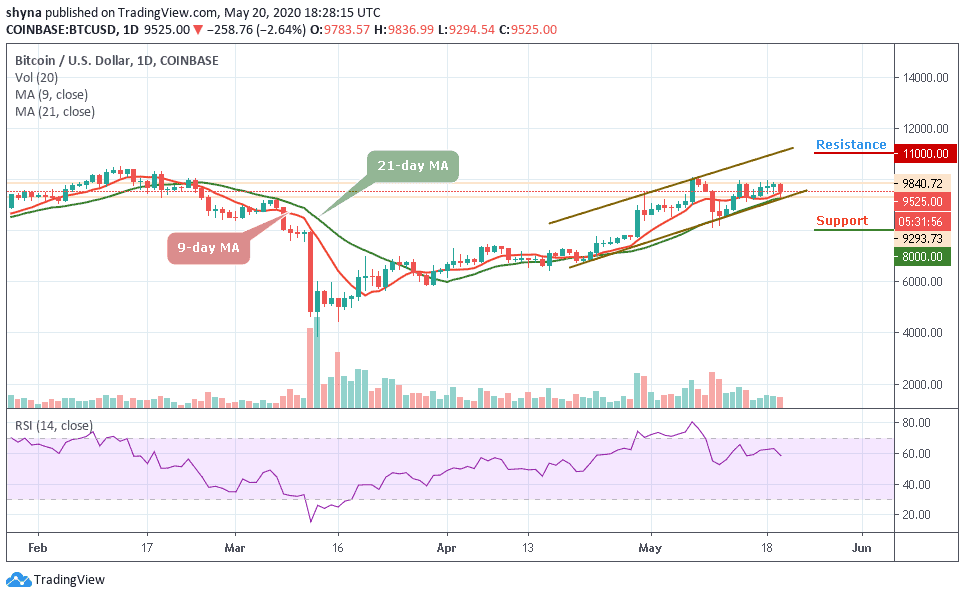
After encountering another rejection at $10,000, BTC/USD is struggling to hold above the intraday support at $9,500 as the coin touches the low of $9,293 today. Since a couple of days ago, the bulls’ focus has been to break the resistance at $10,000 level but just like Monday and yesterday, BTC/USD is currently facing a growing bearish grip as the daily chart reveals.
Take for instance, at the time of writing; BTC/USD is valued at $9,525 after losing 2.64% on the day. The daily chart also shows the possibility of sideways trading taking precedence and a glance at the RSI (14) indicates that the prevailing trend is neither bearish nor bullish as its signal line moves below 60-level. However, as a result, the price of Bitcoin is trading below the 9-day moving average.
Moreover, the current decline is such that the price drops below $9,700 and $9,600 levels. It is currently consolidating above $9,500 and could fix higher. In addition, the main resistance is at $11,000, $11,200 and $11,400. Conversely, if there is no recovery above $10,000, the price may continue to fall to the support levels of $8,000, $7,800, and $7,600 respectively.
BTC/USD Medium – Term Trend: Ranging (4H Chart)
Looking at the 4-hour chart, the Bitcoin price is still under $9,600 and could continue to weaken if the price continues to fall below the 9-day and 21-day moving averages. However, once the current correction is completed, it may likely reach the support of $9,100 and below before the price could allow a decent recovery.
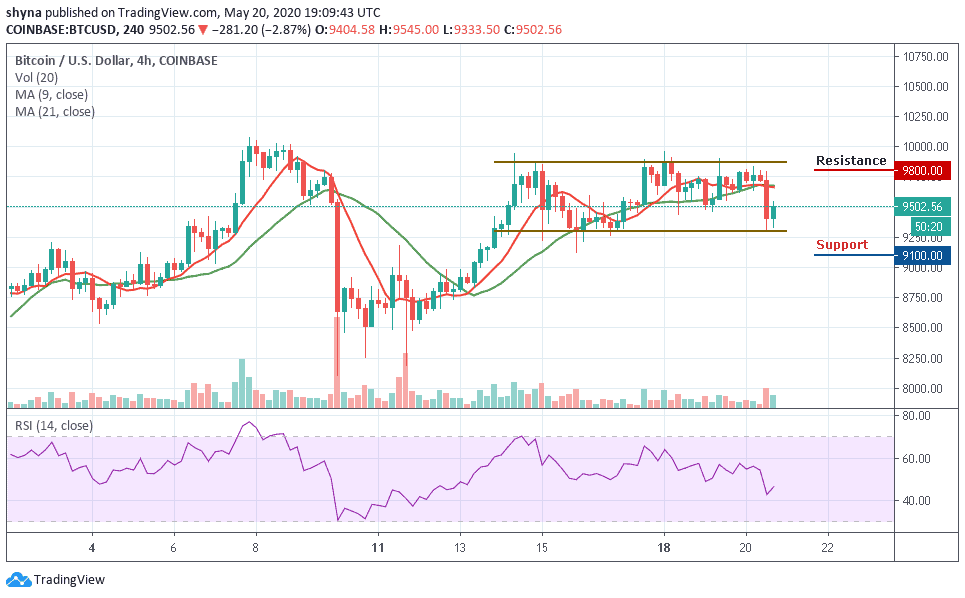
Similarly, the technical indicator RSI (14) shows a downward price momentum, as it is in the bearish zone and the signal line is moving above the 40-level. The BTC/USD may experience further resistance of $10,000 if it raises the much-needed price recovery above $9,800. At the moment, the market is in the ranges of $9,300 and $9,900 levels.
Please note: Insidebitcoins.com is not a financial advisor. Do your research before investing your funds in any financial asset or presented product or event. We are not responsible for your investing results.
Join Our Telegram channel to stay up to date on breaking news coverage